Just in time for the Holidays, we’re again offering a package deal on the HAPI Certification course, all 7-classes bundled for $99!
What is it? Seven half-hour presentations bridging the arts + sciences, revealing how biology and psychology shape our experience of the built environment – inside + out, far more than most realize. All online.
AIA-certified for 3.5 Learning Units (LUs)*, this is the perfect gift for architects, planners, and designers of all stripes, both students and professionals, who are keen to better understand the science behind human design experience – and apply it.
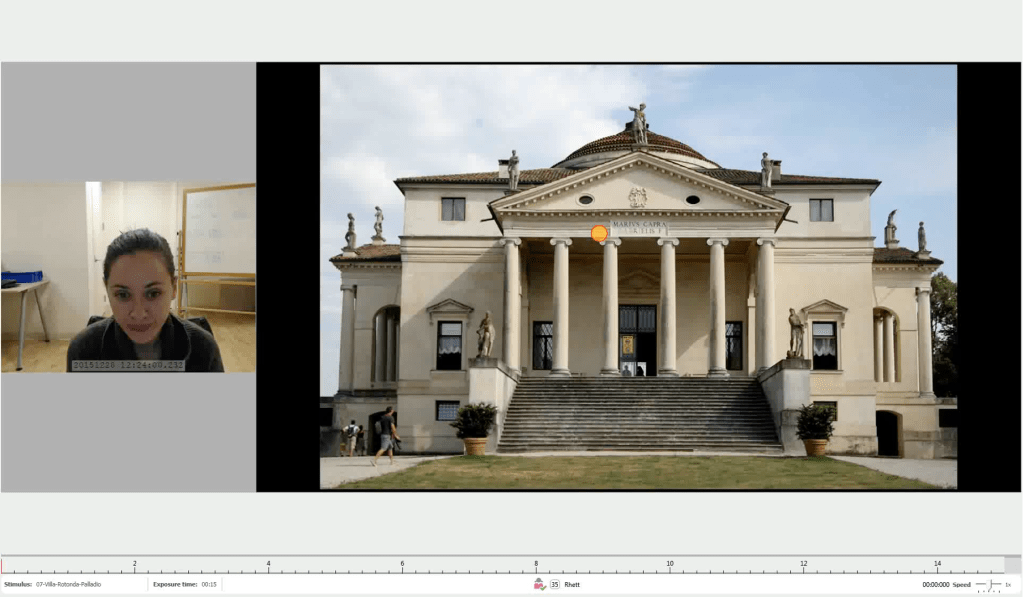
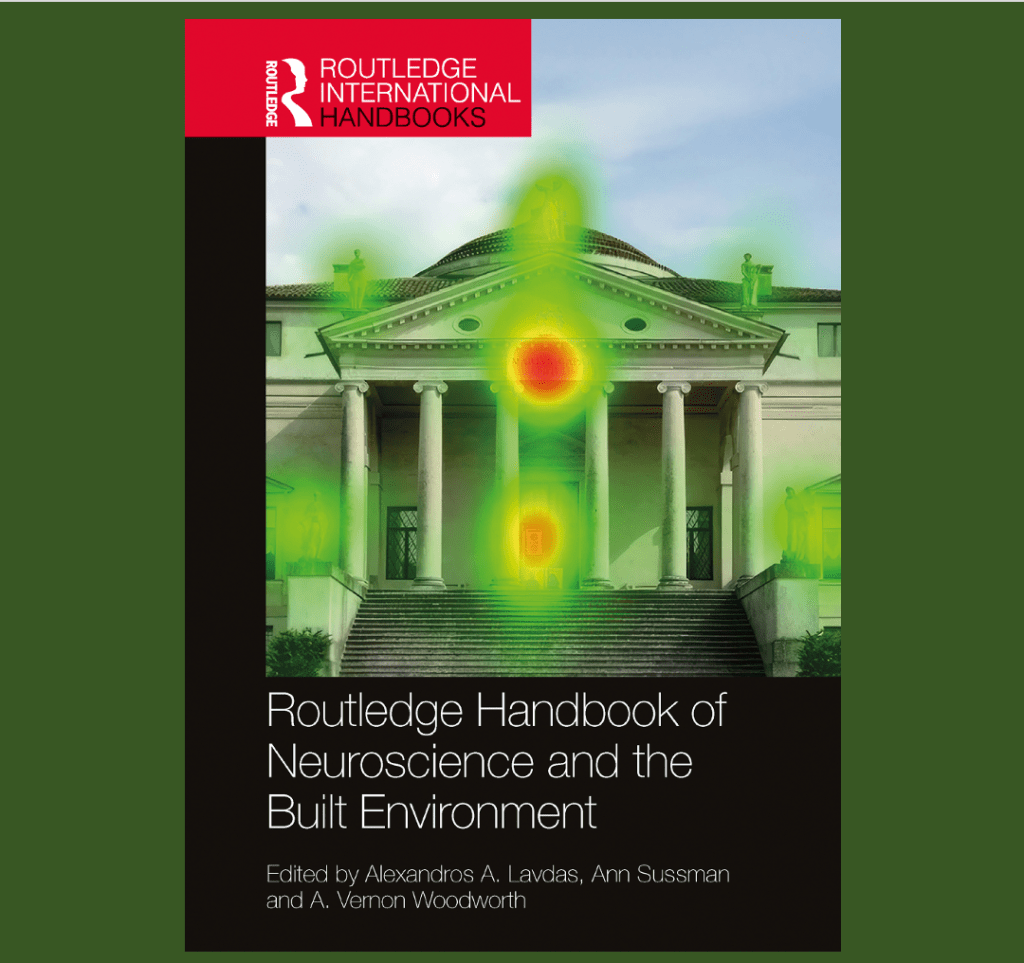
They’ll become familiar with new tools to assess design – including eye tracking, which follows our conscious and non-conscious eye movements, capturing how we take in any scene; (click on image below).
More HAPI Certification Course information is here. Have additional ?s, email: contact(at)theHapi.org
* combined theHAPI courses provide 3 LU|HSWs credits plus 0.5 LU credit
———
theHapi.org is a nonprofit, 501c3, whose mission is to understand the human experience of the built environment and improve its design through education + research.
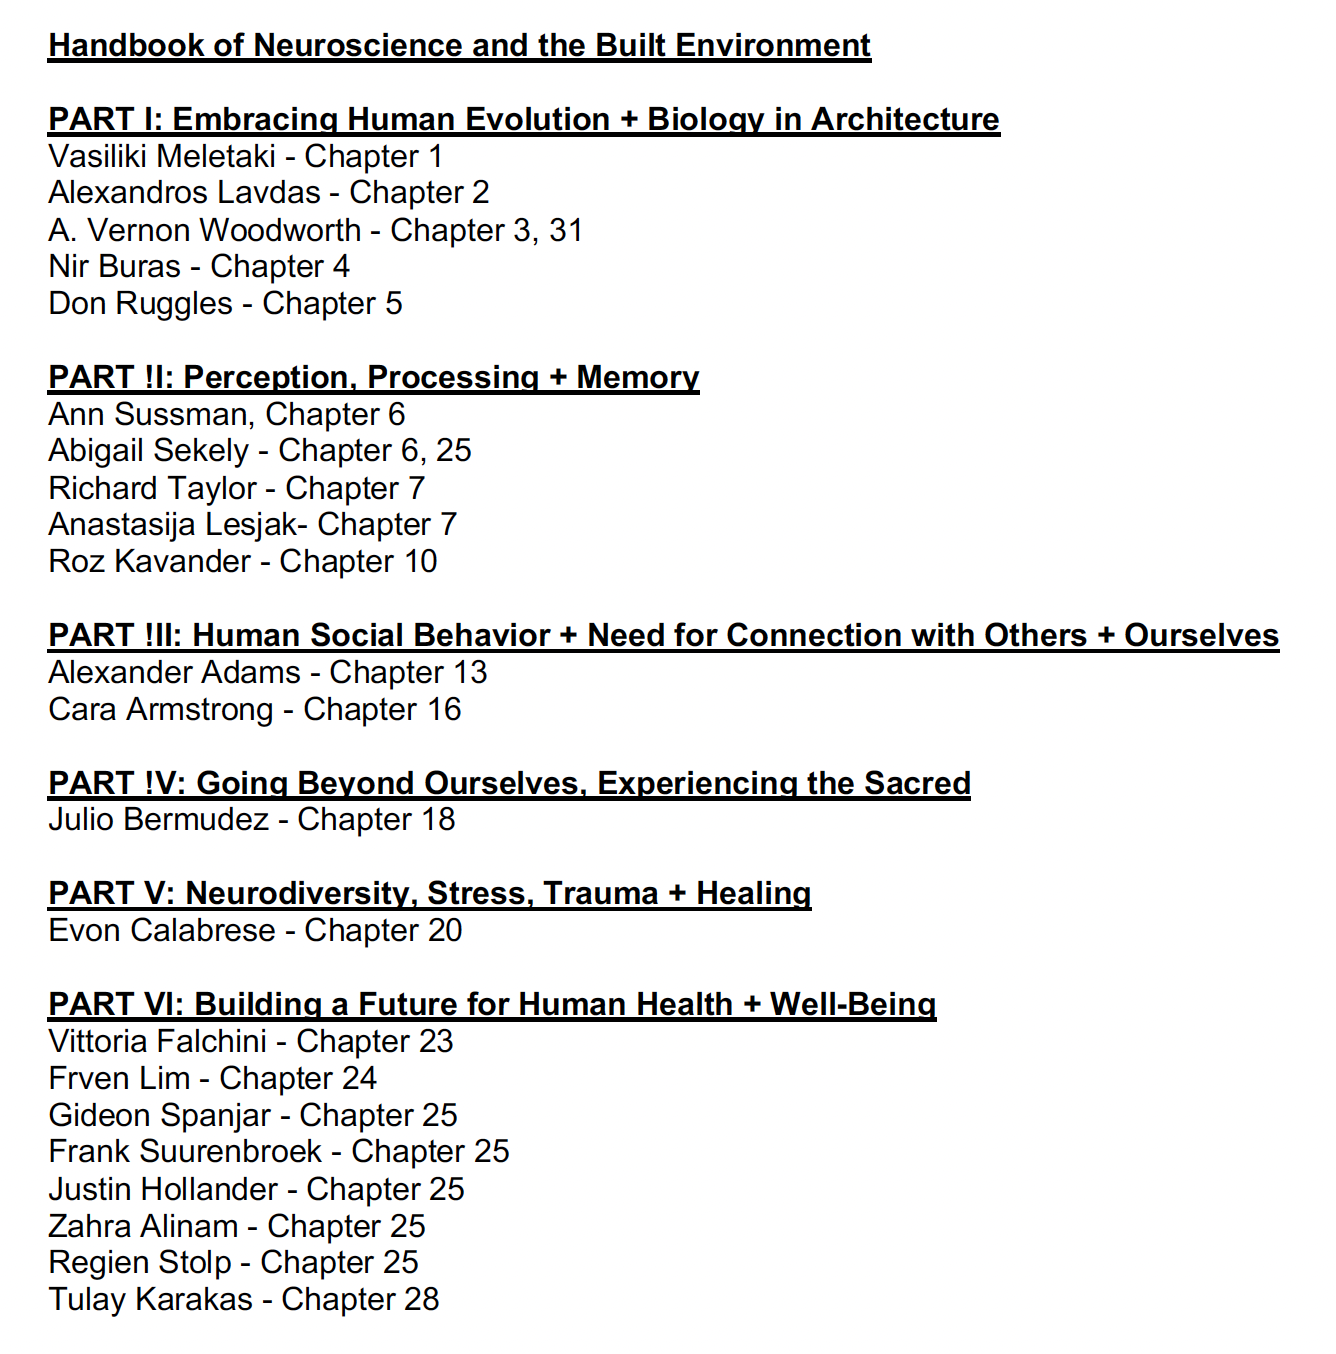
This session, moderated by Michael Mehaffy, includes brief talks by contributing authors of 15 of the book’s 31 Chapters, see list below, and a Welcome by its co-editors, Alexandros Lavdas + Ann Sussman.
Participants heard about our transformative time, how new understandings in the life sciences are game-changing for architecture and urban design, for understanding what people need to see and be in to be at their best.
Here’s the draft list of remarkable speakers, who briefly talked about their Handbook chapters:
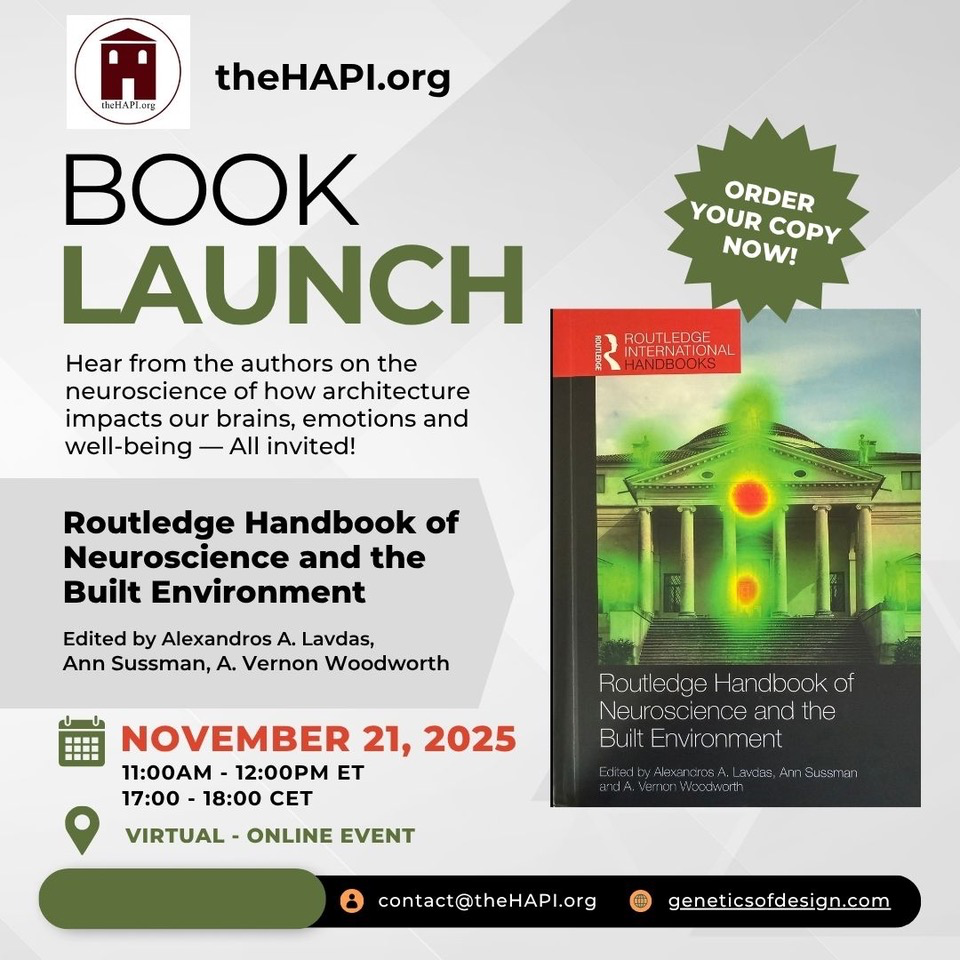
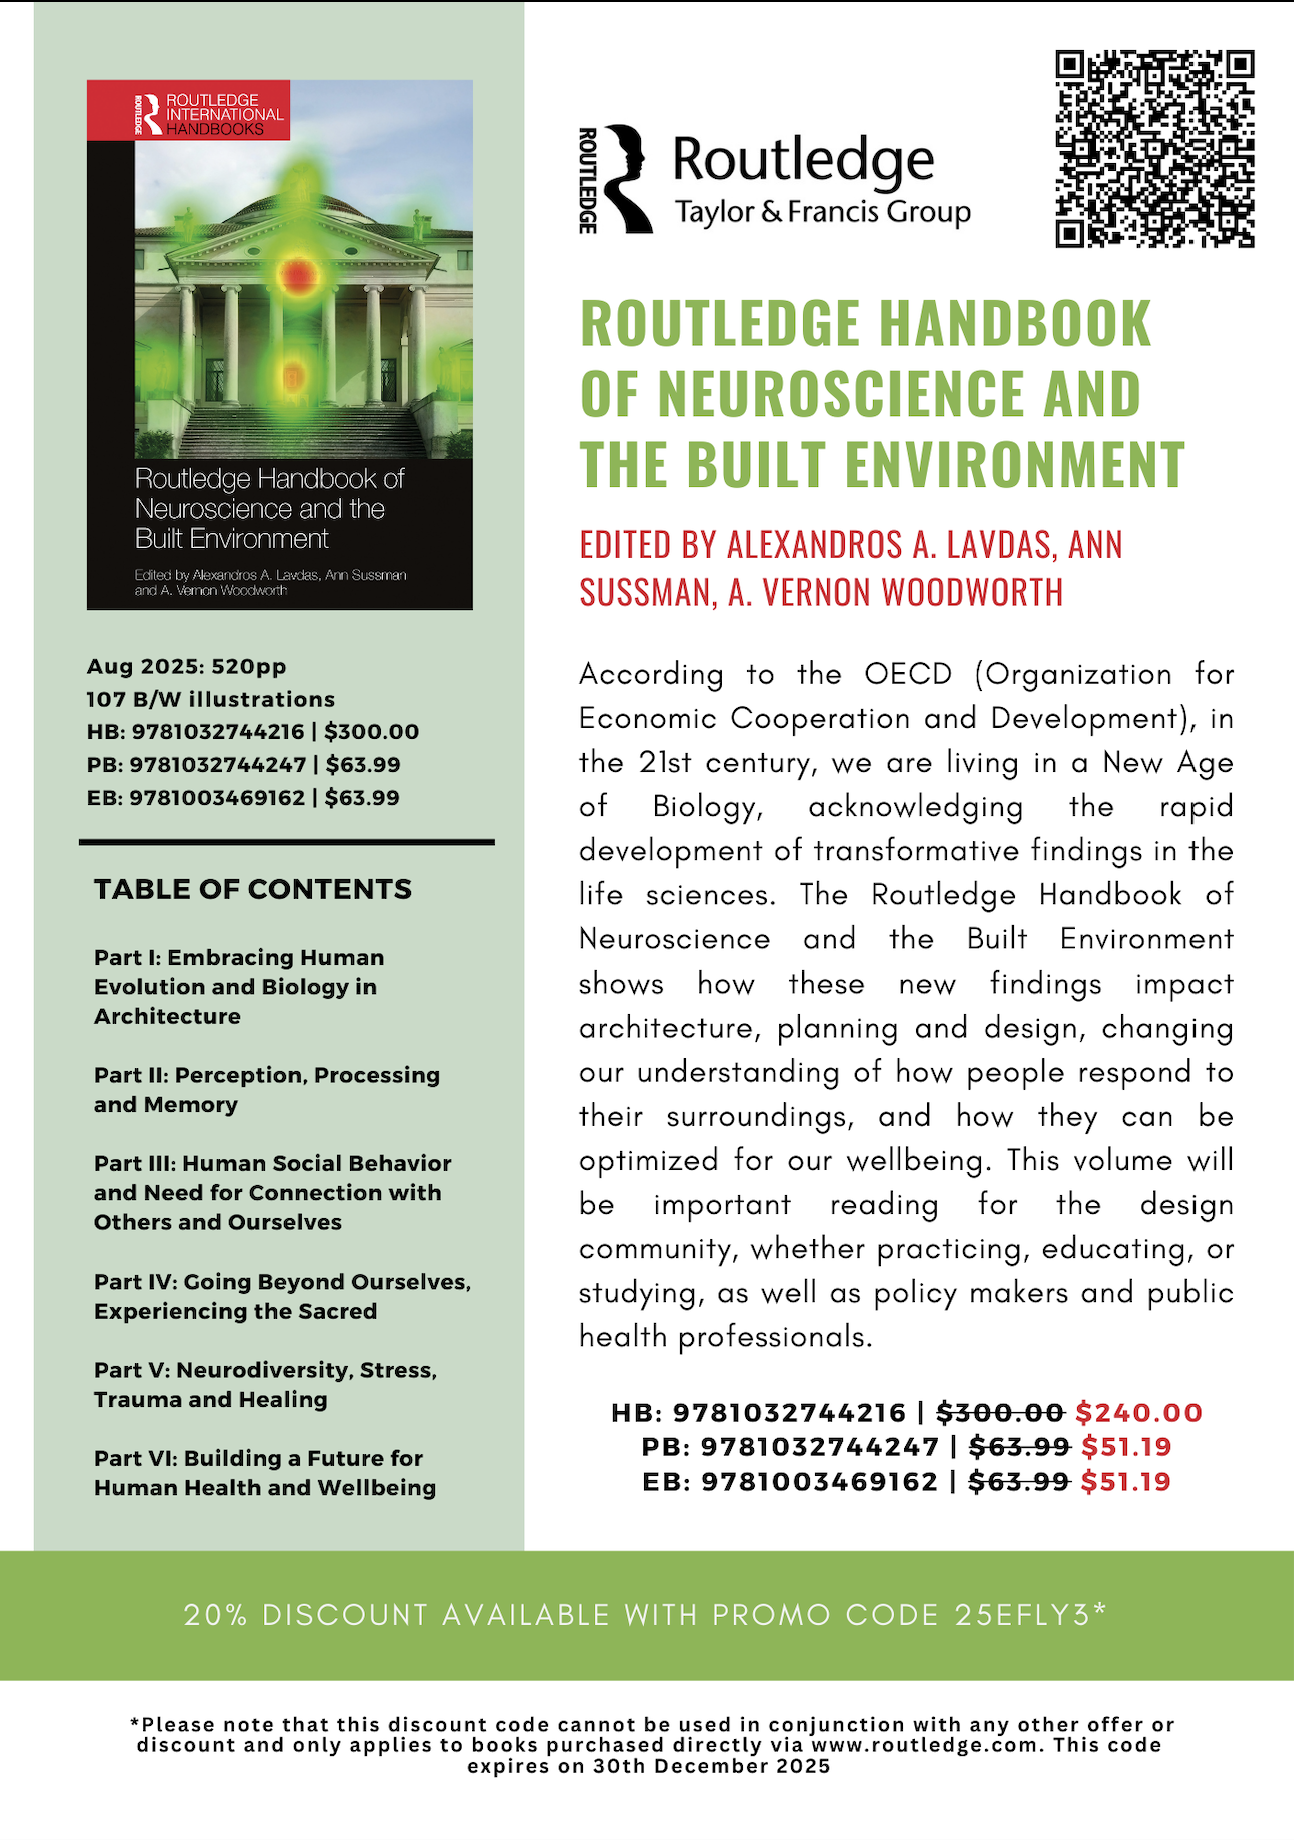
Edited by Board Members of theHapi.org, the Handbook reflects our game-changing times in the 21st-century, where new understandings in the life sciences, prove transformative for design fields, including architecture, planning and interior design, helping us appreciate what people need to see and be in to be at their best!
Compiling 31 Chapters by 51 authors on four continents, the Handbook provides a new foundation for architects, academics and the public at large to understand the human experience of place, revealing how our experience begins subliminally and reflects our evolution.
With Introductions by Susan Magsamen of the International Arts + Mind Lab and Micheal Mehaffy, of the Sustasis Foundation, the Handbook presents six sections, with chapters delving into human perception, our need for social connection, discussions of how color, shape and form impact our behavior, as well as how biometric tools, including eye-tracking and AI tools, provide a new lens to ‘see’ both architecture and ourselves.
The 2025 discount code for the new Handbook, noted in flyer below, is: 25EFLY3*
Feel free to share the flyer. For a freePDFof the Handbook’s first 80-pages, including the Table of Contents, Introduction and first three Chapters, click on the PREVIEW BOOK button in the link below:
Anyone with a laptop or PC with webcam, can participate; on a Mac, link to them from Google Chrome or Firefox (and it’s best to do so in a quiet space with minimal distraction.)
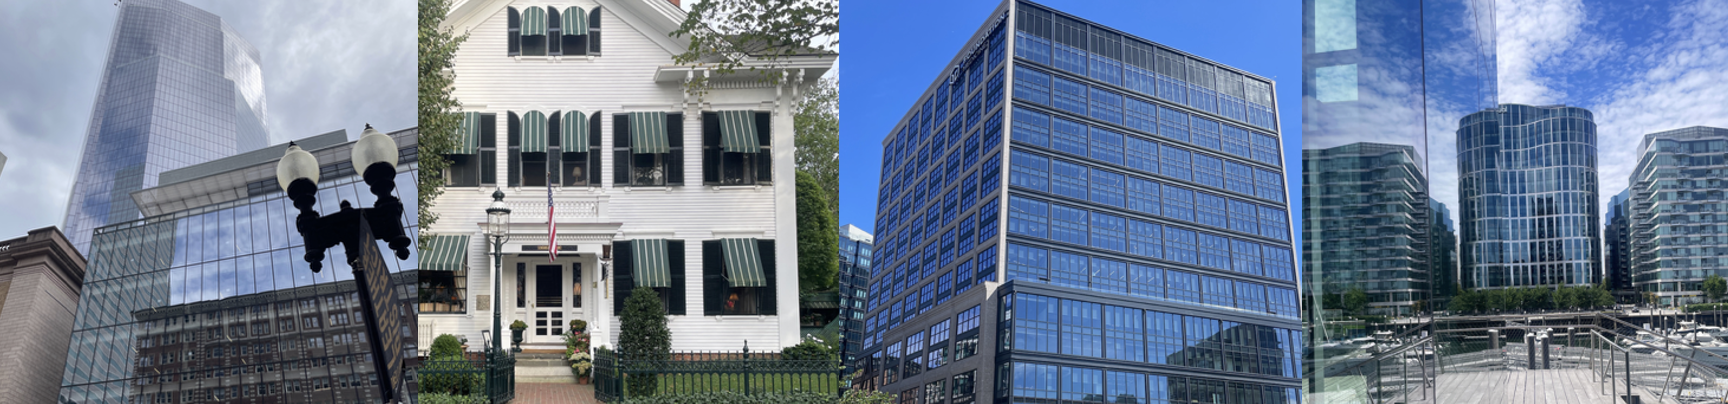
These studies, sponsored by theHapi.org, look at how humans really look at buildings, using state-of-the-art eye-tracking and facial-expression-analysis software from iMotions.com, a global purveyor of biometric tools for human behavioral research. Once on site, each study directs you to eye-tracking calibration slides – where you simply focus on a shape as it moves across the screen – before the study begins; each one takes about 4 minutes to complete.
theHapi.org hopes to share results shortly. Reach out if you have any questions or ideas for future studies; email us at, contact@theHapi.org
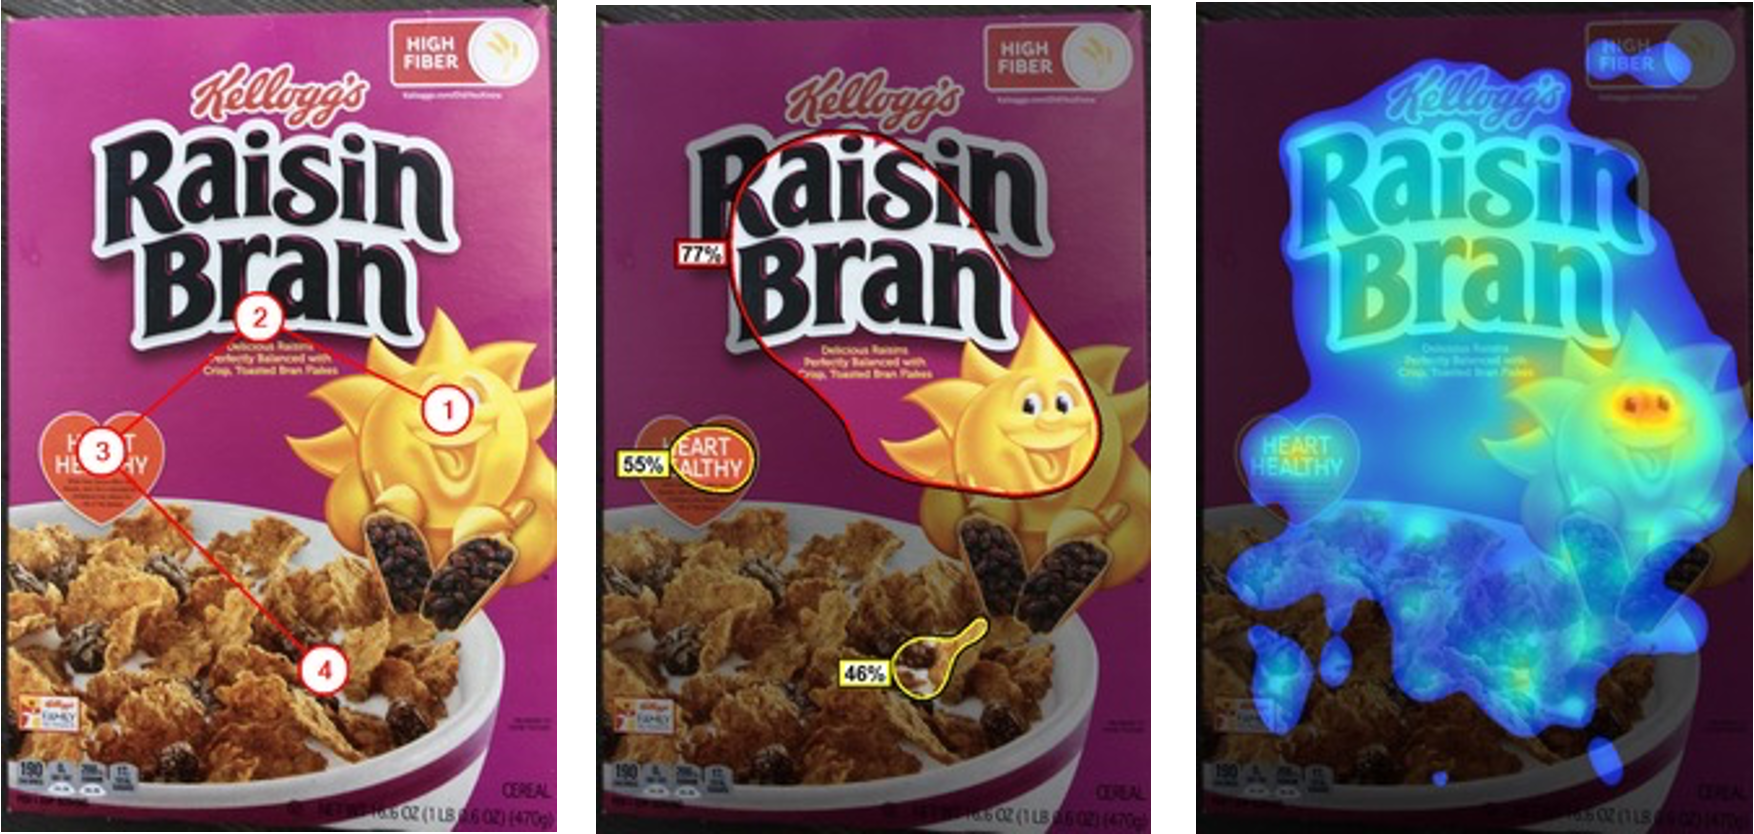
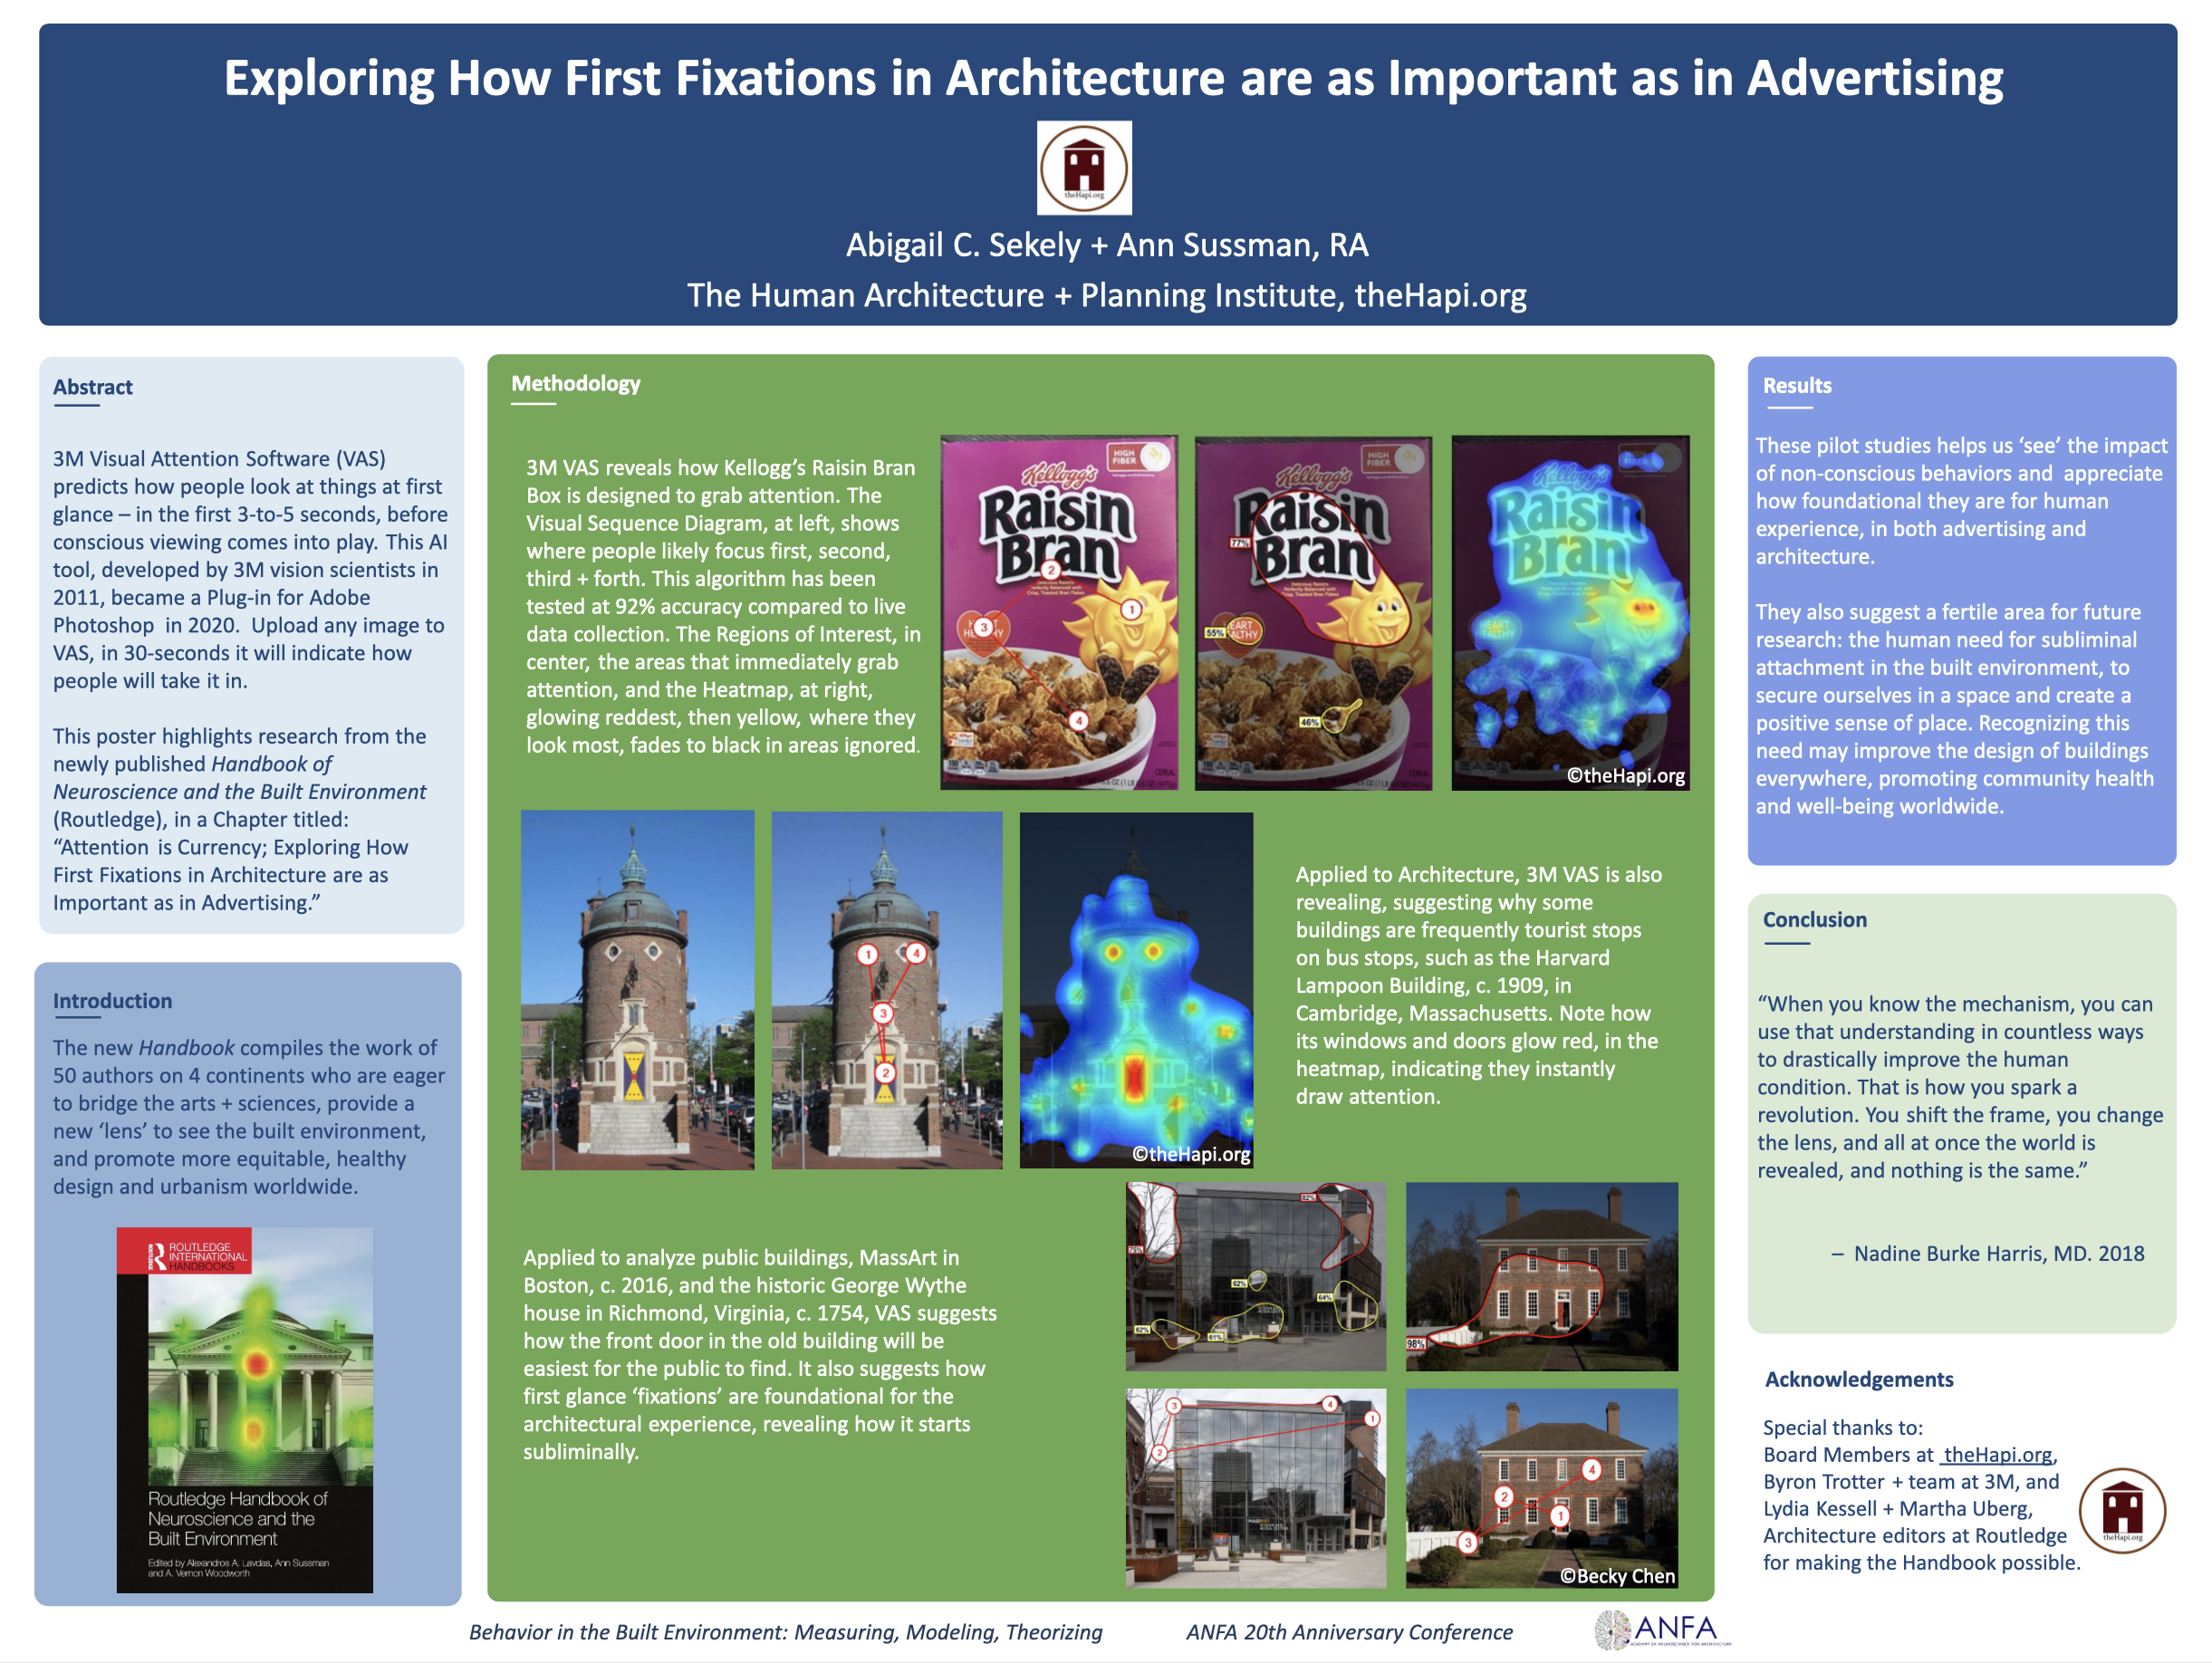
How do we take in our world? Like the animals we are, of course; that’s what 3M Visual Attention Software (VAS), reveals quickly. Developed by 3M vision scientists in 2011, VAS became a Plug-in for Photoshop in 2020, and we see it as valuable for designers of all stripes. Upload any image to this AI tool, and in less than a minute, you’ll learn what immediately gets attention.
Take the Kellogg’s Raisin Bran box, above – VAS analysis show nothing about its design is arbitrary – at all! The Visual Sequence Diagram, top left, shows where people likely focus pre-attentively (without conscious awareness or control) indicating where they look first, second, third + fourth. The Regions of Interest (or Hot Spots), in center, the areas focused on as a percentage, and the Heatmap, at right, aggregating the data, glowing reddest in areas most looked at, then fading to yellow and blue where attention diminishes, showing black in areas ignored. We see here how the smiling sun effectively brings attention to the box, which makes sense, given the human evolutionary bias for focusing on faces and direction of gaze.
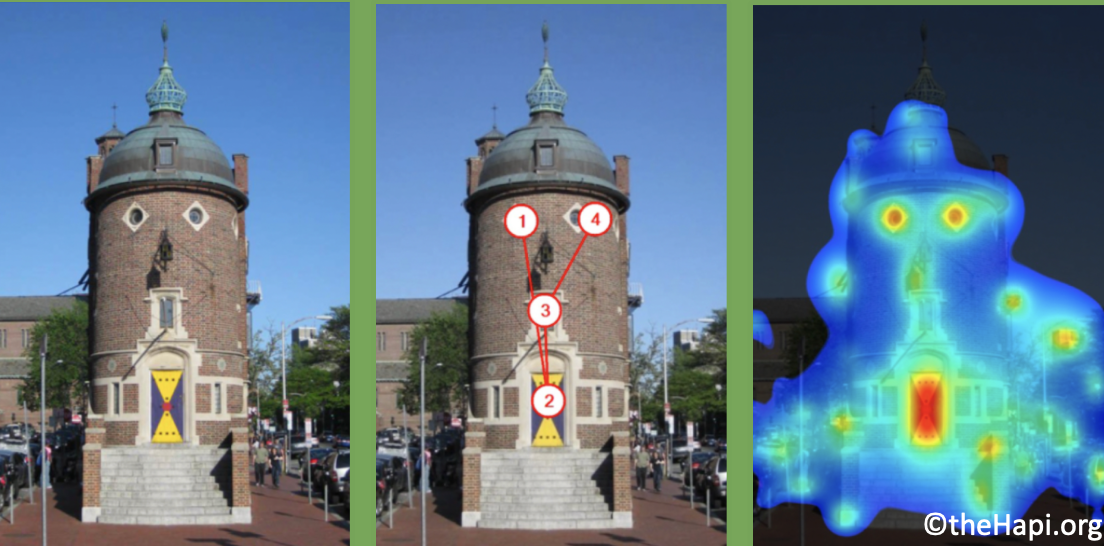
Applied to Architecture, 3M VAS is equally revealing, suggesting why some buildings are frequently on tour bus stops, such as the Harvard Lampoon Building, c. 1909, in Cambridge, Massachusetts. Note how its windows and doors glow red, in the heatmap, at right, indicating they instantly draw attention. No surprise, tourists stop to take photos and selfies here!
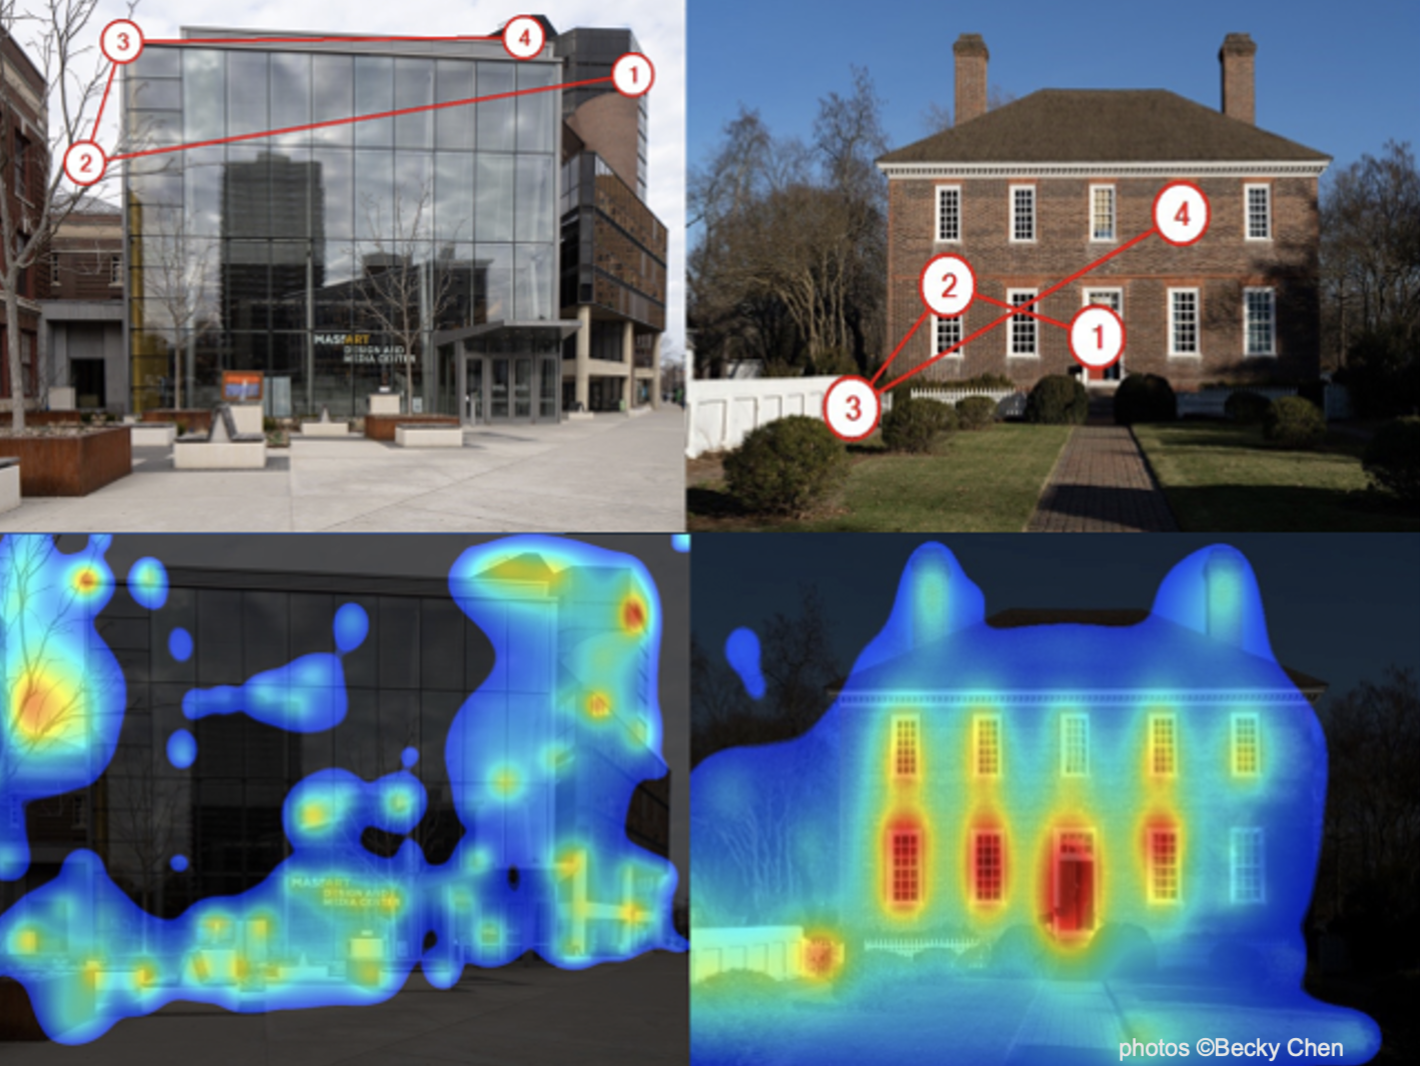
Applied to analyze public buildings, MassArt in Boston, c. 2016, and the historic George Wythe house in Richmond Virginia, c. 1754, above, VAS suggests how the front door in the old building will be easiest for the public to find, in this study by BAC student Becky Chen. Note how the Visual Sequence Diagram starts on the door of the old building, while the first fixation is on the roof of the newer one (!) and how the front door of historic structure glows red, while the Heatmap of the modern building is bathed in black and blue. VAS suggests here how first glance ‘fixations’ are foundational for the architectural experience. (Something our nonprofit, theHapi.org, is interested in further exploring; let us know your thoughts!)
To learn more about these pilot studies, check out the Poster below, presented at the ANFA 2025 Conference in California, this month! (Click to enlarge)
This 2025 eye-tracking study (#10) is out for analysis.
Sponsored by theHapi.org, the study looks at how humans really look at buildings, using state-of-the-art eye-tracking and facial-expression-analysis software from iMotions.com, a global purveyor of biometric tools for human behavioral research.
theHapi.org hopes to share results shortly. Feel free to reach out if you have any questions or ideas for future studies; email us at, contact@theHapi.org
You can find results of our previous biometric research here and on our other GeneticsofDesign posts:
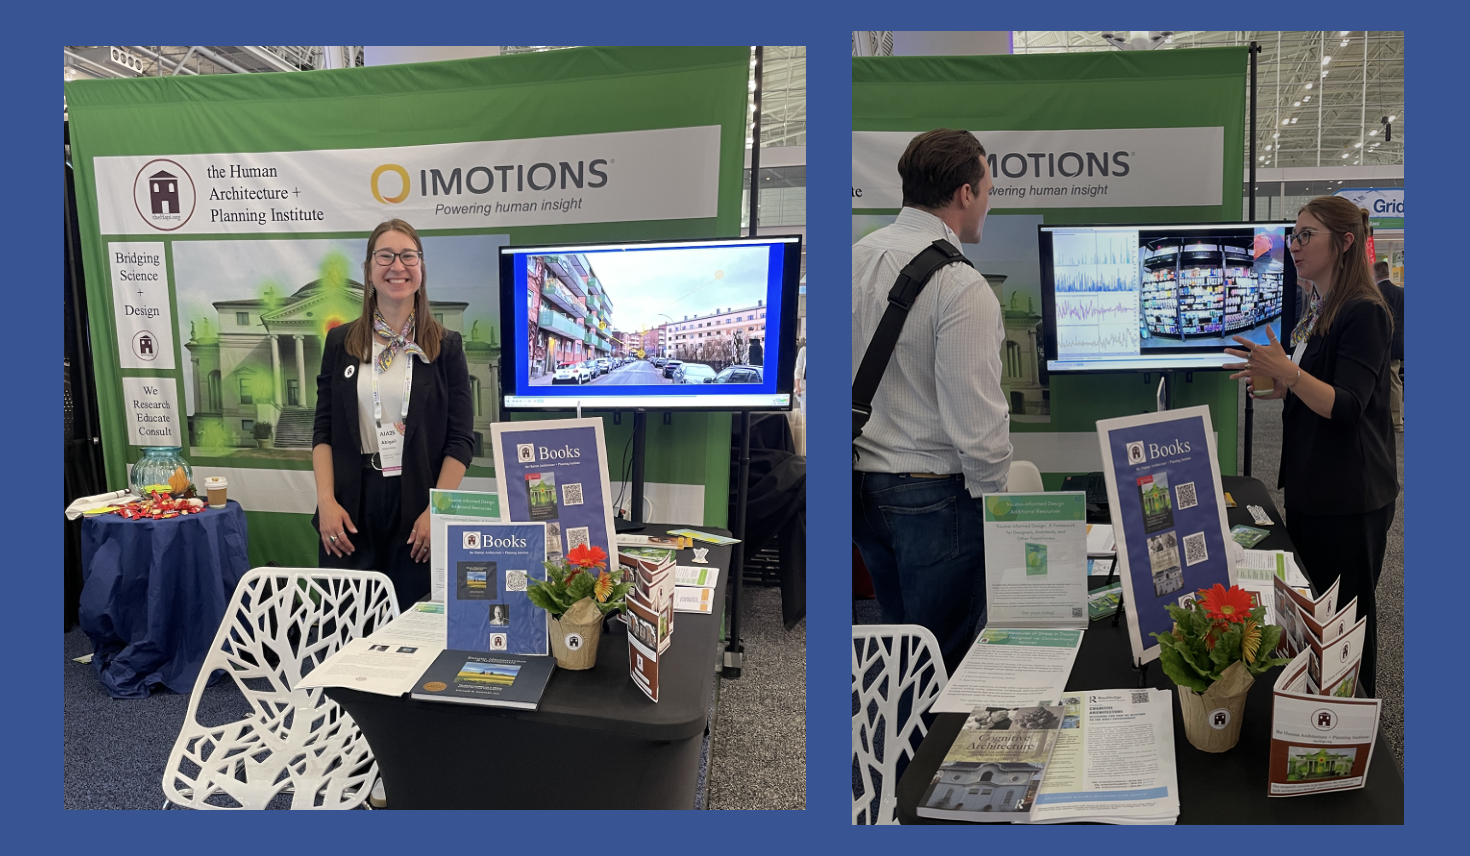
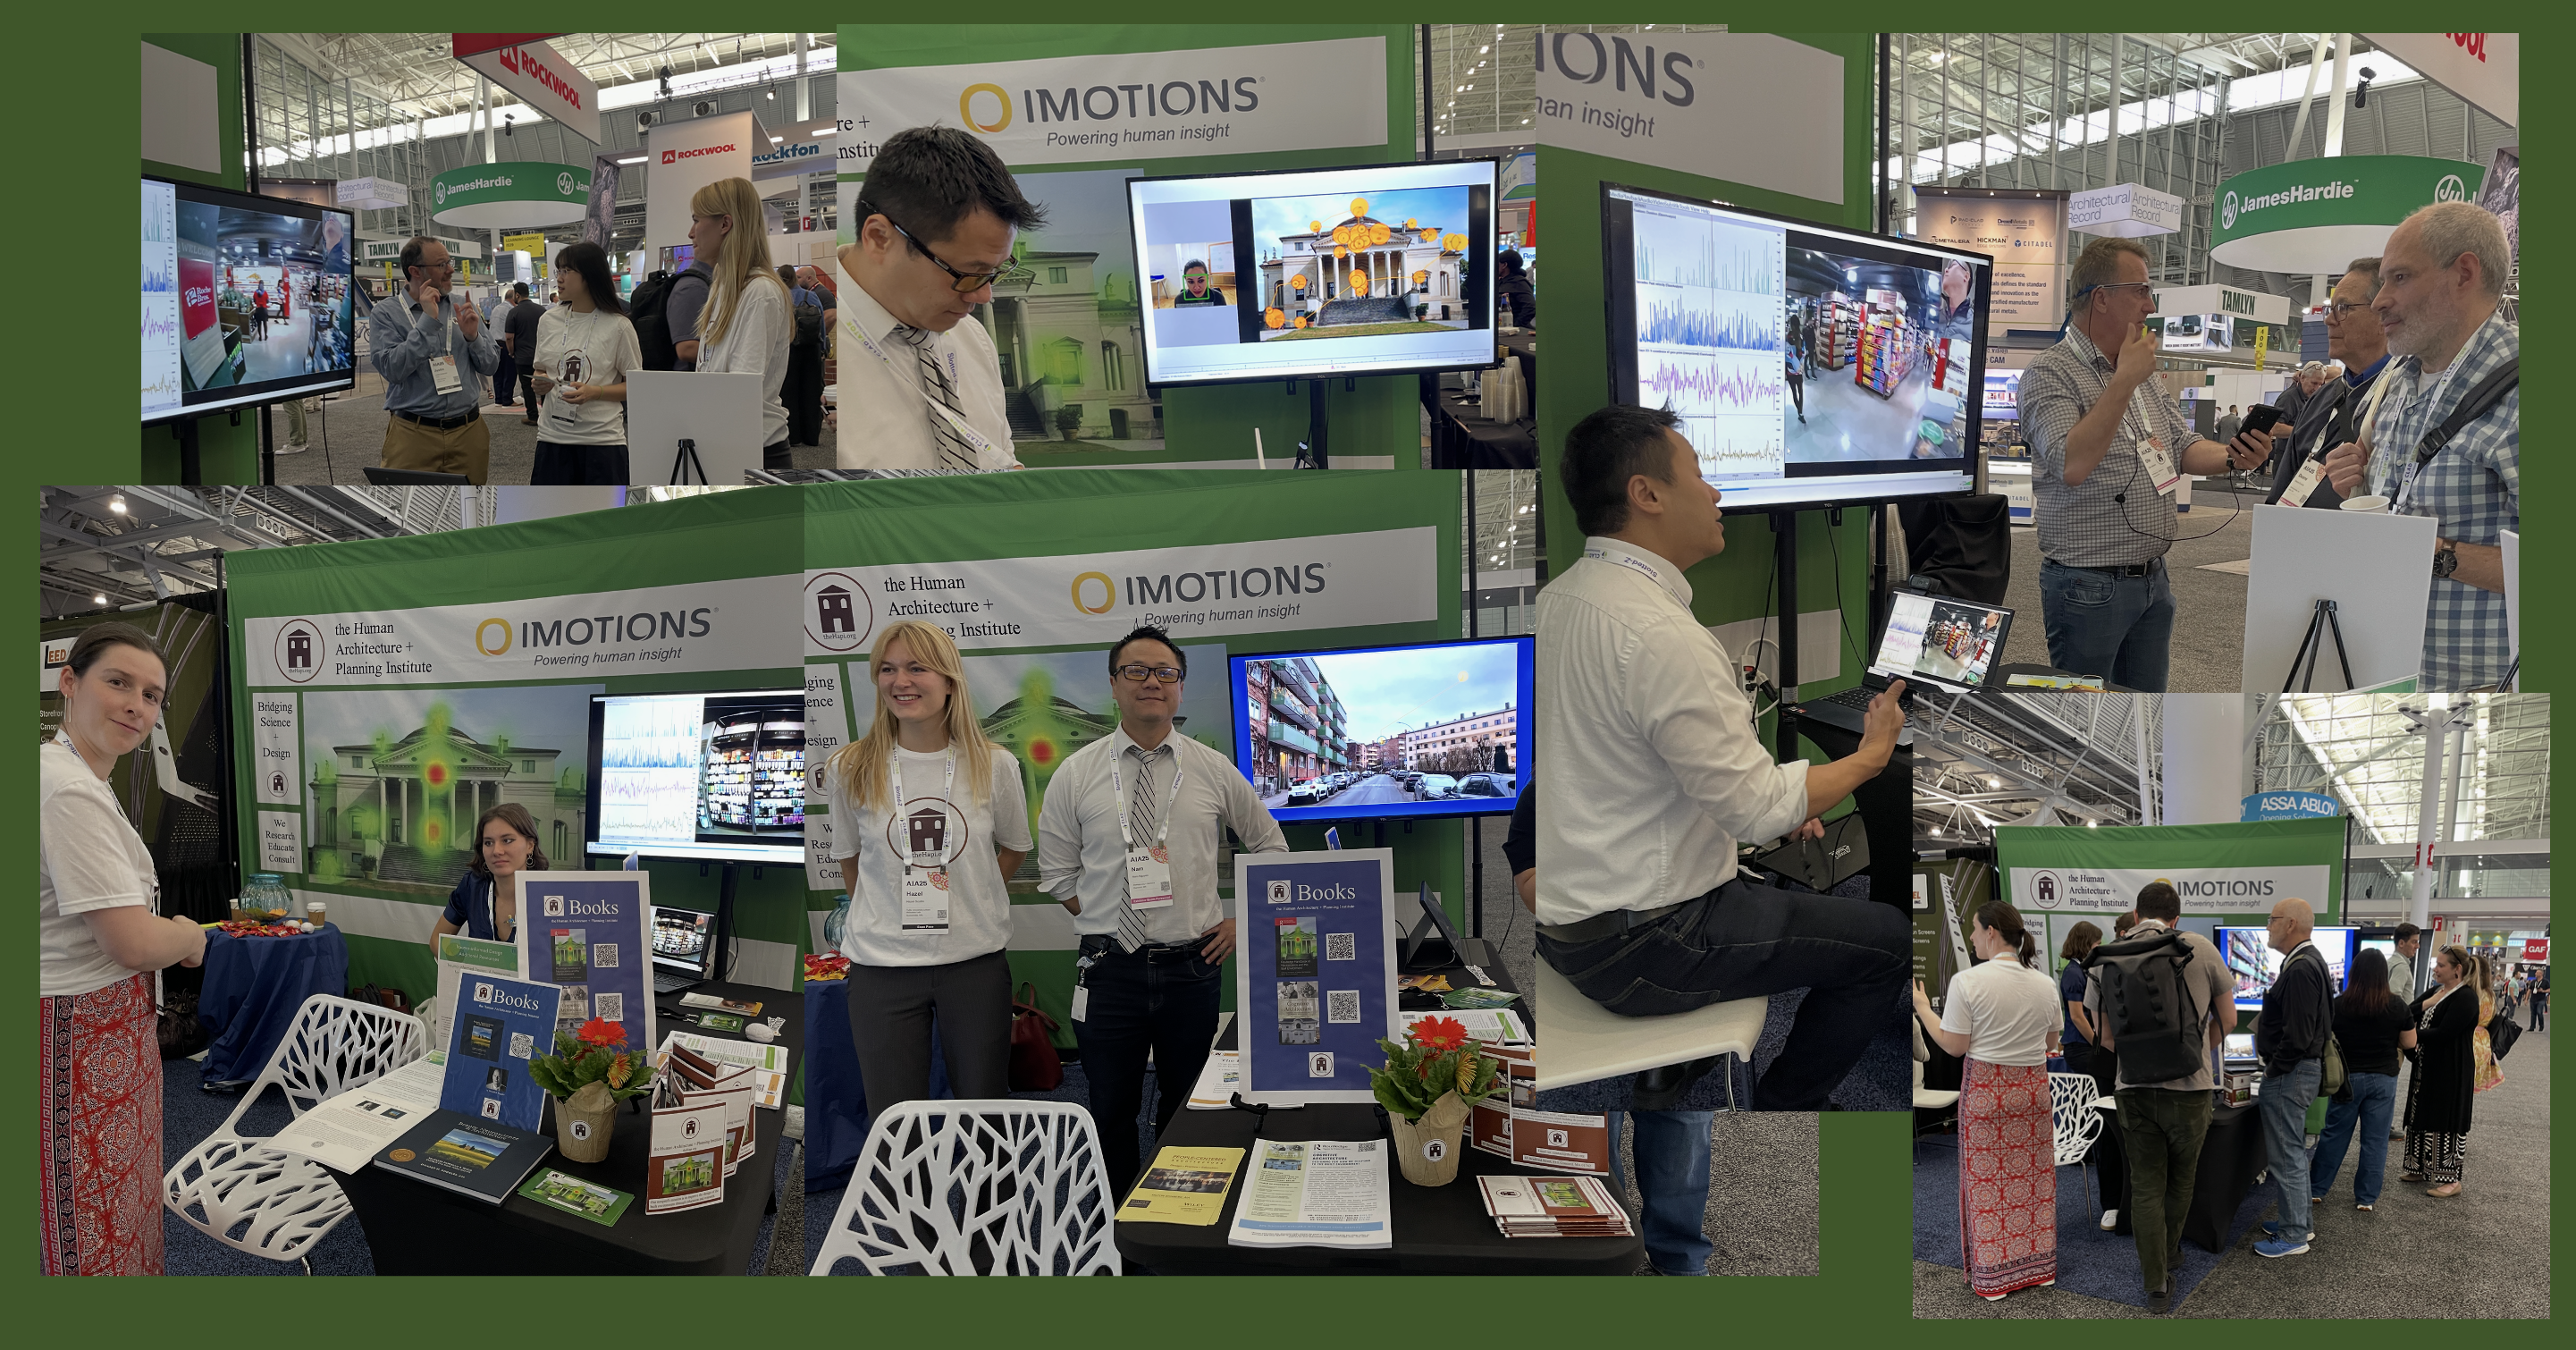
This year’s AIA Conference drew an international crowd to Boston’s Convention Center. Our nonprofit, the Human Architecture + Planning Institute (theHapi.org) was thrilled to be part of it; sharing a booth at the expo with iMotions, a global purveyor of biometric tools. Here’s pictures of the booth, #1862:
Definitely a very animated event:
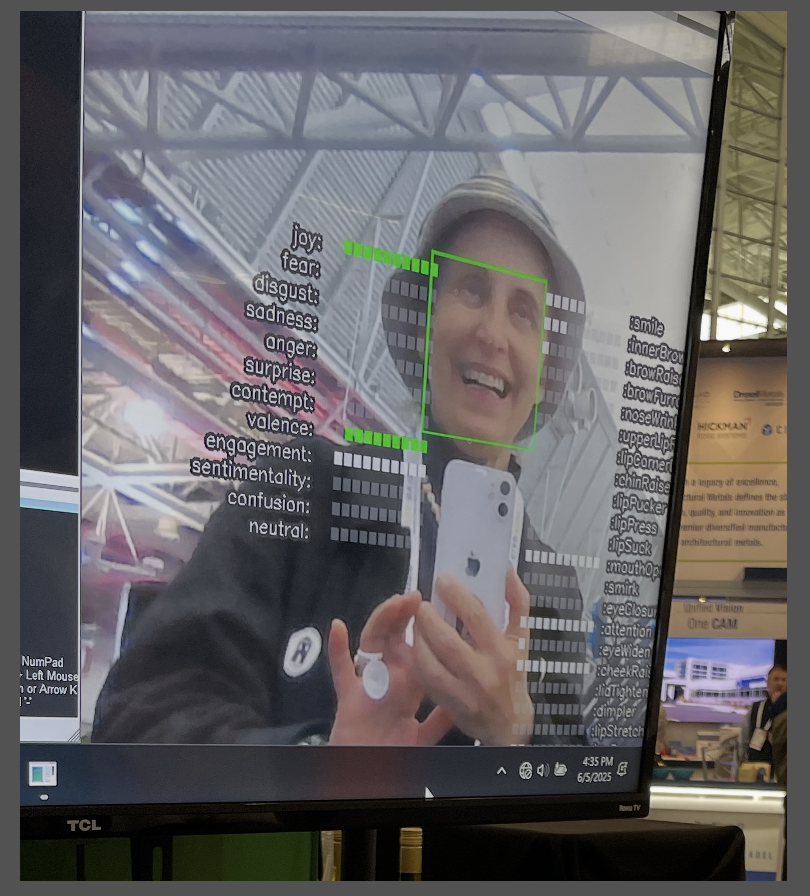
People stopped by to learn about eye tracking, which follows conscious and non-conscious eye movements and to try out facial expression analysis software, that reflects your changing expressions more quickly than one might imagine:
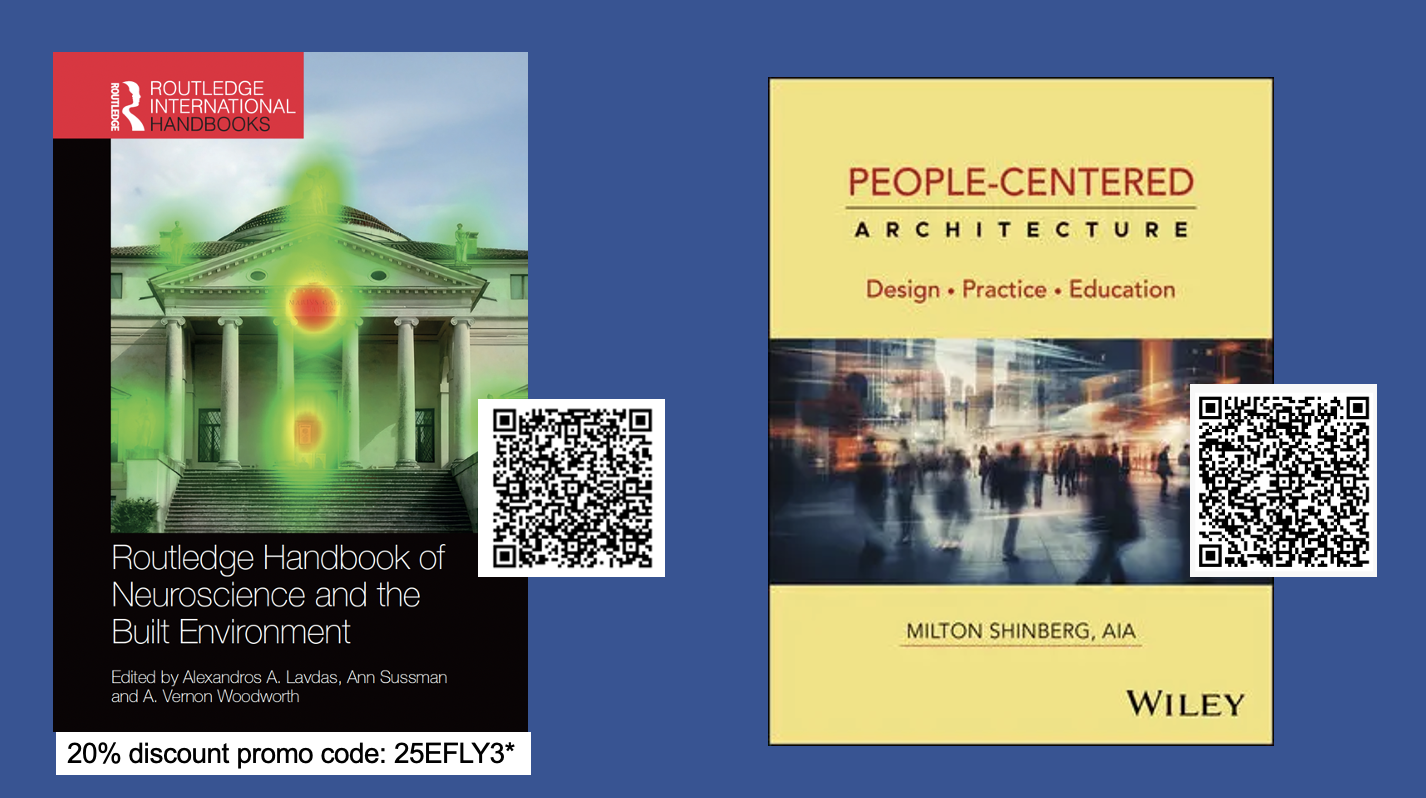
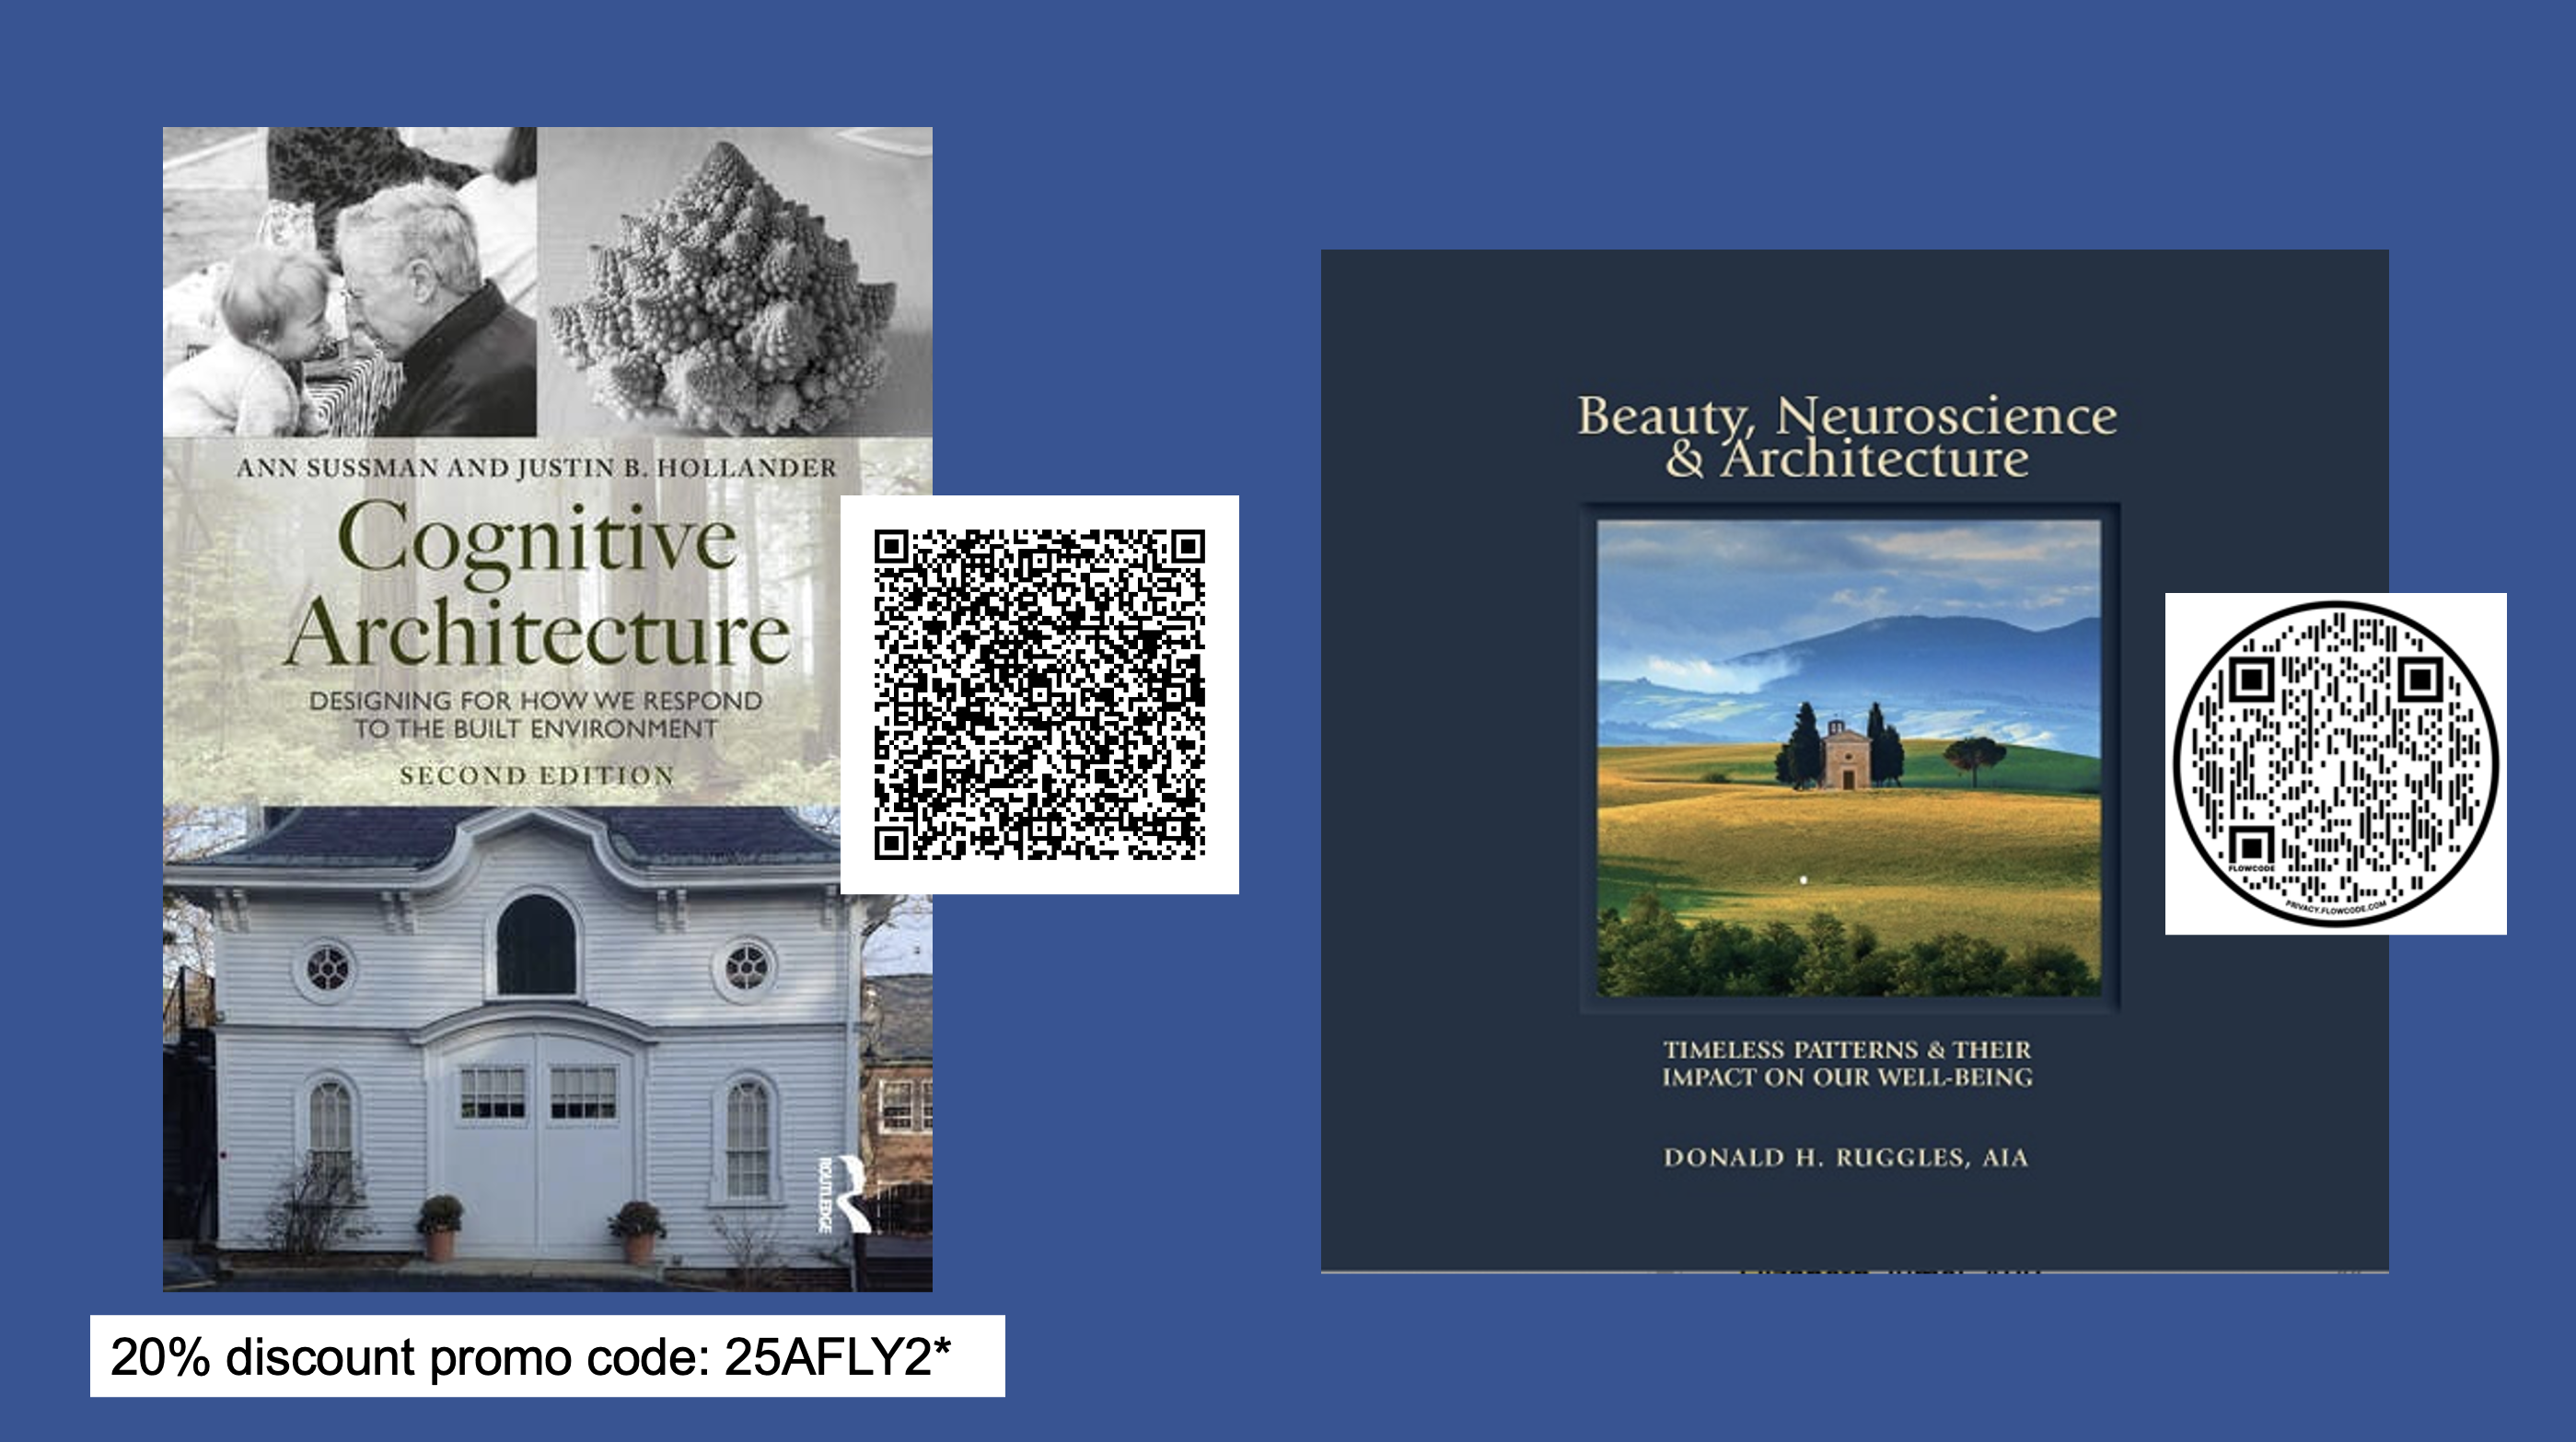
All these tools are available for designers and architects to use today to better understand the human experience of the built environment, and improve design outcomes, by doing so. That’s the mission of theHapi.org, to improve design through education and research. Books displayed at the booth promoted human-centric, biologically-aware design, included the forthcoming Handbook of Neuroscience and the Built Environment (Routledge), due out this September, and the newly published People-Centered Architecture (Wiley) by Milton Shinberg.
For more information on the books at the booth, check out QR codes (+ discount codes) below – click on the images to enlarge;
And a big thank-you to all our collaborators, Nam, Kieu, Ole from iMotions; Justin, Hazel, Agatha, Lili, Rhone-Ann, from Tufts; and theHapi Team, Abigail, Kelsey, Linda, Don and Milton – your expertise, energy + books, made this booth happen, bringing people together, making history!
How do we see buildings? This 5-minute online eye-tracking study, helping expand understanding of how we experience the built environment – is now out for analysis.
These studies use state-of-the-art software from iMotions.com, accessible on any laptop or desktop computer equipped with a webcam; on a Mac, link to it from Google Chrome or Firefox, (and it’s best to do so in a quiet space with minimal distraction.)
These studies are sponsored by theHapi.org (the Human Architecture + Planning Institute) a nonprofit dedicated to understanding the human experience of the built environment and improving its design through education and research.
Your participation helps expand our understanding of how humans experience the built environment and what we most need to see to be at our best.
And thank you for your participation; we should have results out soon.
Have ?s or need more info; email contact(at)theHapi.org
This study is now out for analysis; we’re looking to have the results and more studies up soon. Interested in understanding how humans experience the world around them? Then take part in theHapi.org‘s eye-tracking studies, all welcome!
These studies use state-of-the-art software from iMotions.com to reveal the subliminal impact of architecture that impacts human behavior and health more than most realize.
They run on any laptop or desktop computer equipped with a webcam. Participants need to be in a quiet room with minimal distractions. The studies generally take about 6 minutes in total, including 2 brief calibration videos set up to follow your eye movements.
If you have ?s or would like more info; email contact(at)theHapi.org
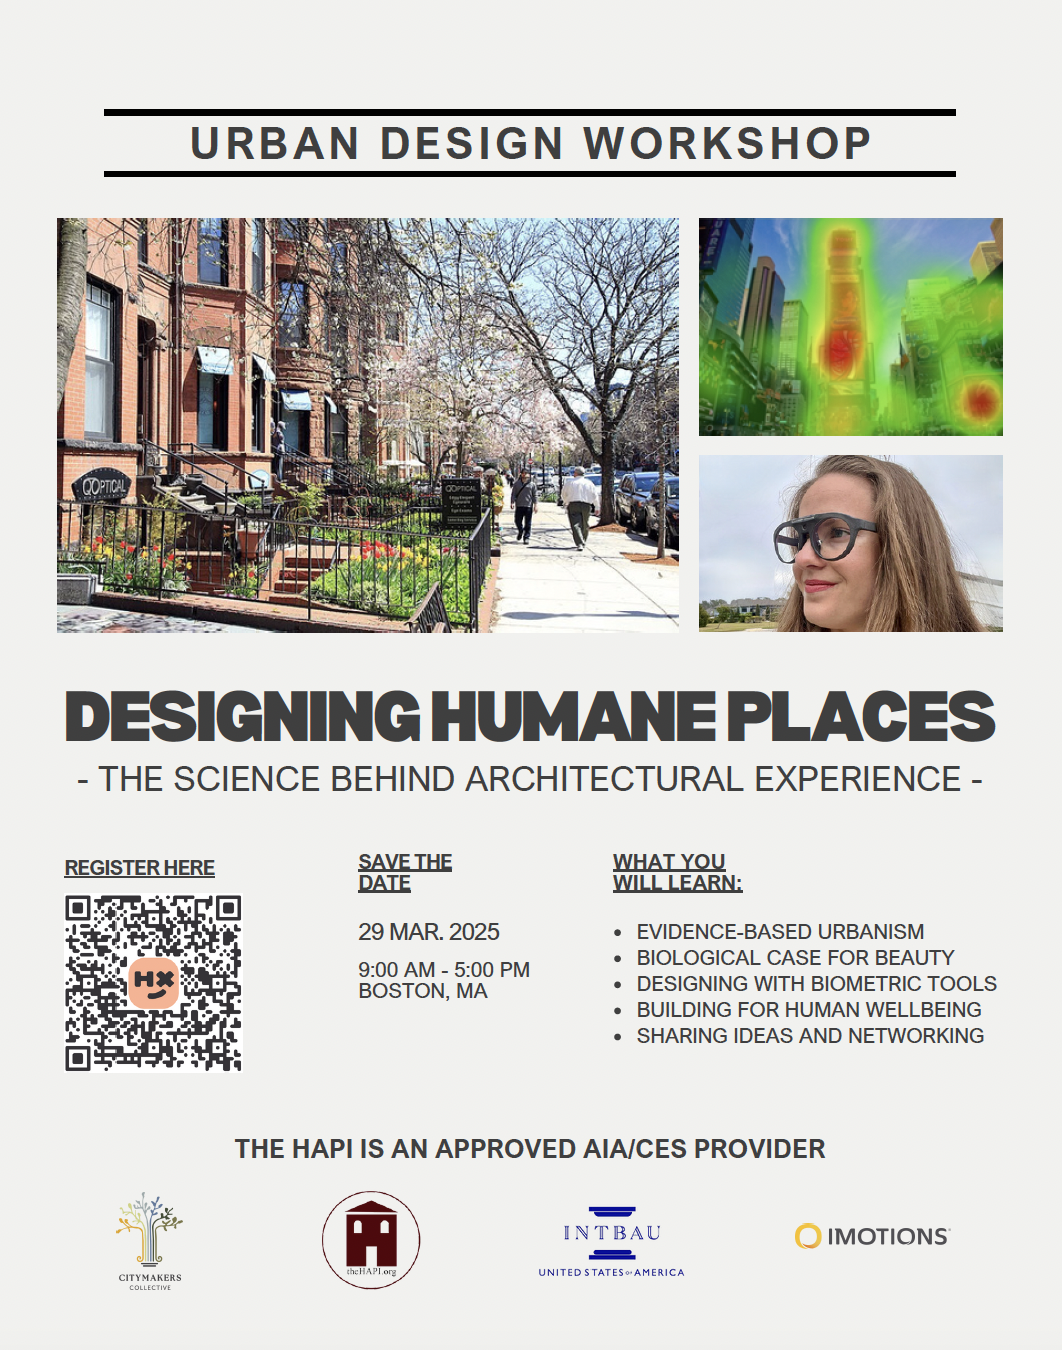
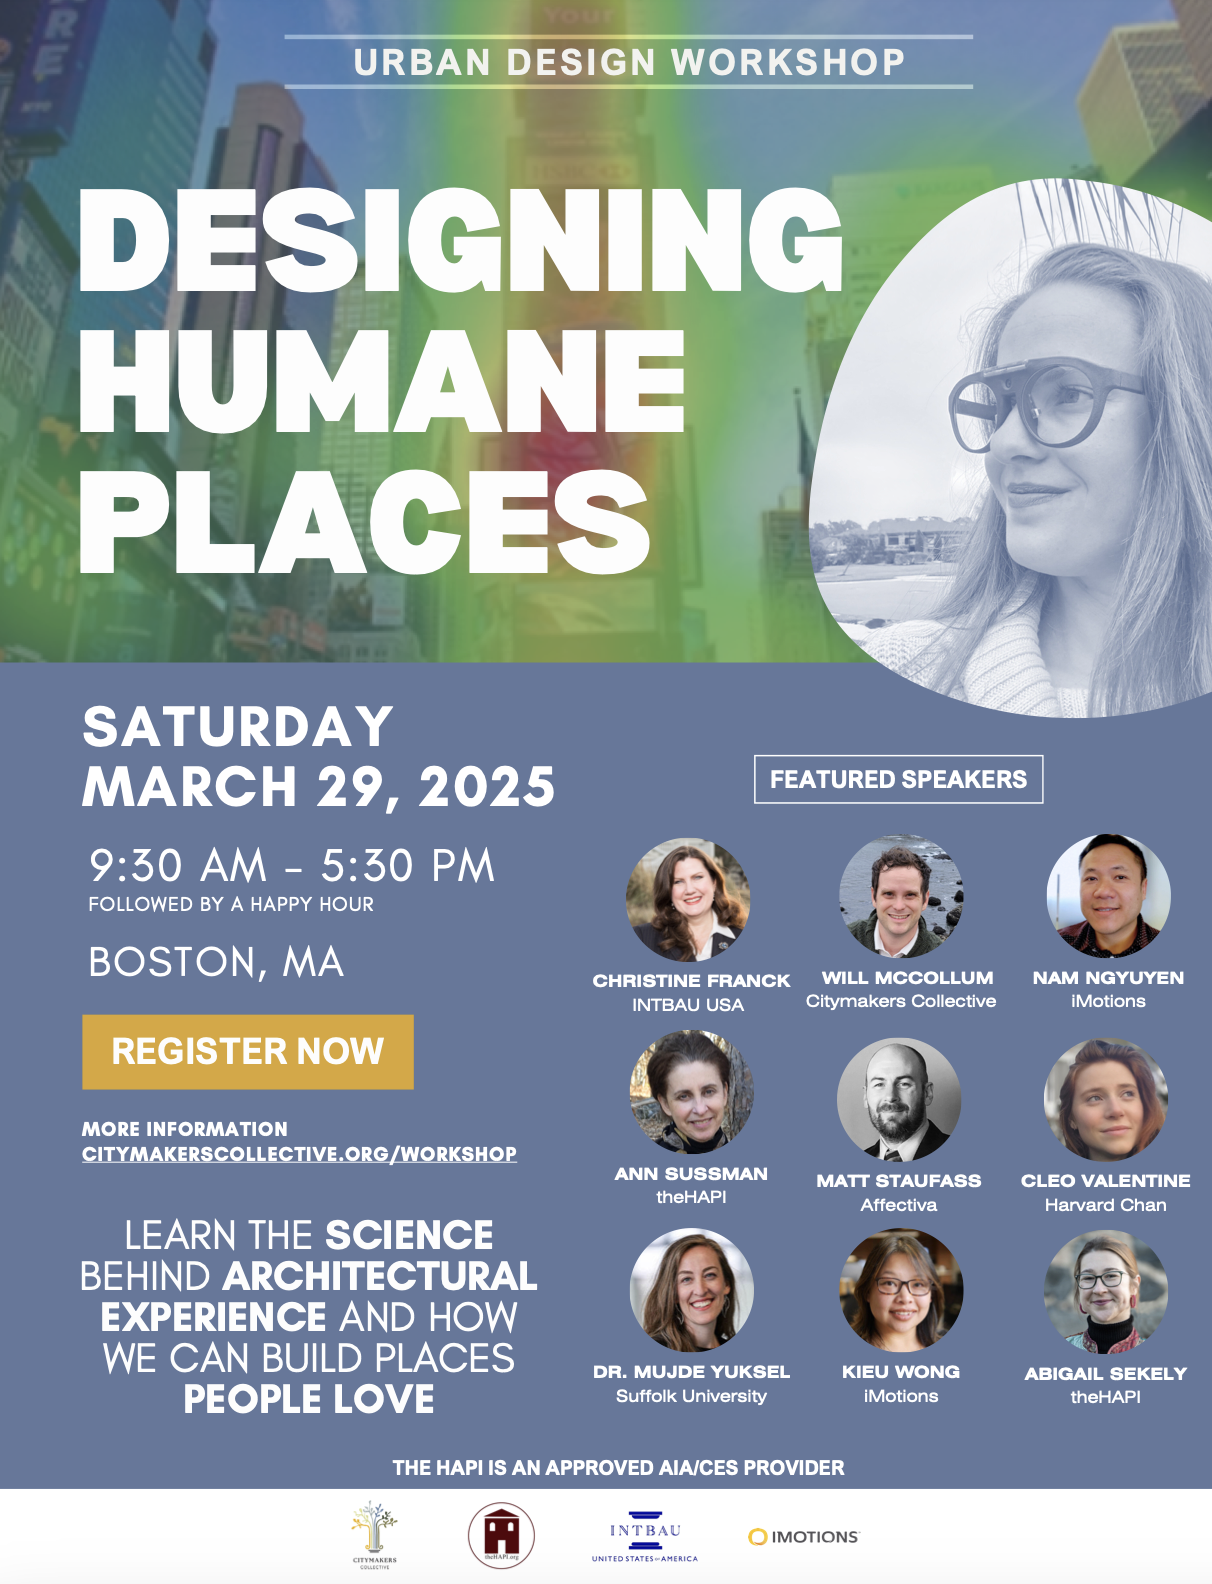
Interested in ‘seeing’ the latest science behind our experience of the built environment? Then come by to this day-long workshop in downtown Boston, Saturday, March 29th, 2025. Open to all, professionals, architects, planners, students and the public. We promise you’ll leave with new understandings not only about how architecture impacts us – but about yourself, and how to build a better future for us all.