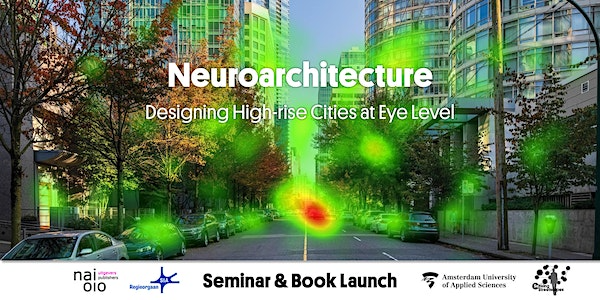
These talks explore the power of today’s biometric tools, including eye tracking, to reveal how we ’see’ architecture, planning + the public realm; they offer new insight into how to build better places for us all as well as new explanations for why time-less designs stay that way.
At the SNEAPA conference in New Haven this fall, we asked more than two dozen planners to draw ‘a house‘. Participants took part in the House Experiment, a study where they are asked to made a quick sketch. And while they all work on their own – they also all generally end up drawing something quite similar, as shown below:
But in reviewing the results from the New Haven ‘House Experiment’, we noted something else – how often the sketches included a tree or several trees and bushes. Yet these were never asked for; participants were not prompted to include Nature or greenery or any context! Yet in 52% of cases, (16 of 31 participants) they did – adding a tree, bushes, flowers or combination of natural elements to the sketch.
Could this be regional? After all, conference attendees were in New England, an area known for forests and greenery. So, we reviewed the results from a ‘House Experiment’ study done in Amsterdam, the Netherlands, in 2019. At this conference, 46 people, attending Greenbuild Amsterdam, were asked to draw ‘a house’; they turned in similar results, bilaterally symmetrical buildings with face-like facades. Participants hailed from 17 countries, including the U.S., and in 15 cases, (33%) they, too, added a tree. Here are sample results, with country of origin noted below.
Do humans have a tree bias? These preliminary studies suggest indeed we do; thinking of a house, people often draw a tree next to it – no matter where they come from. It fits, when you learn that we share 50% of our DNA with trees; they are – quite literally in us.
It all brings to mind the wise quote from the poet, Rumi:
’There is a voice that doesn’t use words. Listen.’
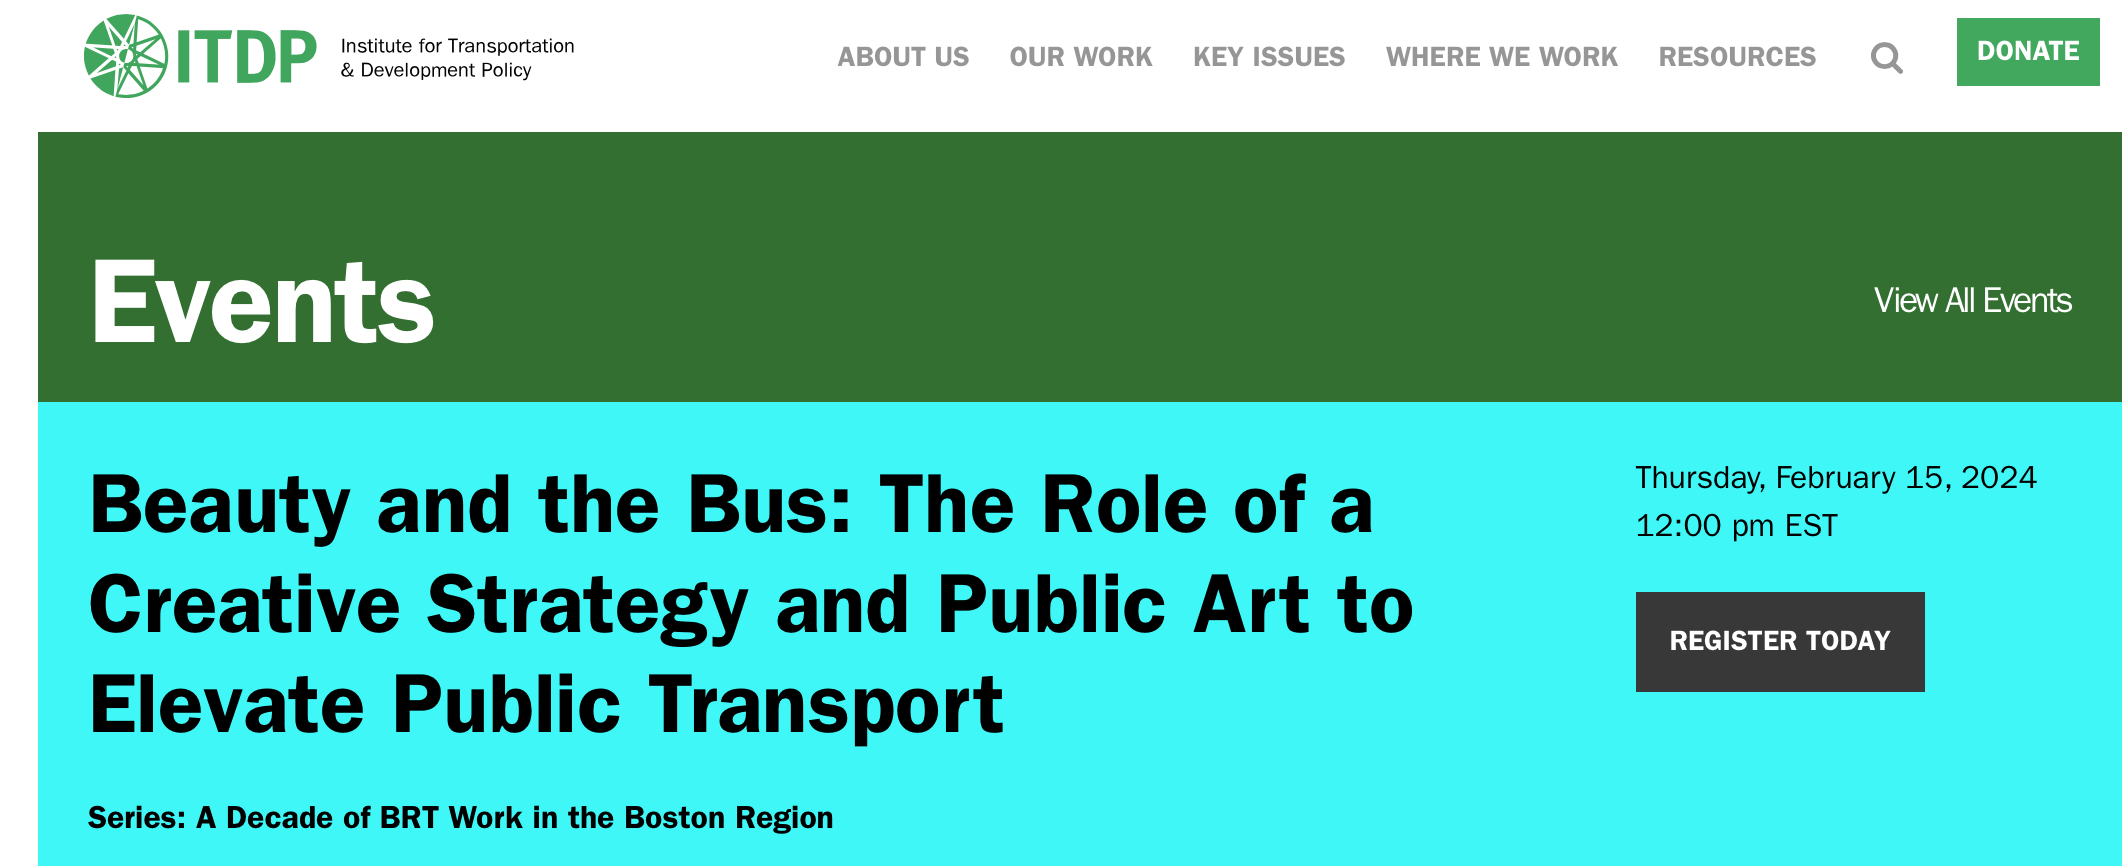
How do people look at bus stops? What catches their eye? What makes them happy? In this pilot study prepared for the City of Chelsea with ITDP-US (Institute for Transportation Development Policy), we asked these questions and learned just how much color and design matter when it comes to drawing people’s attention to a transit stop.
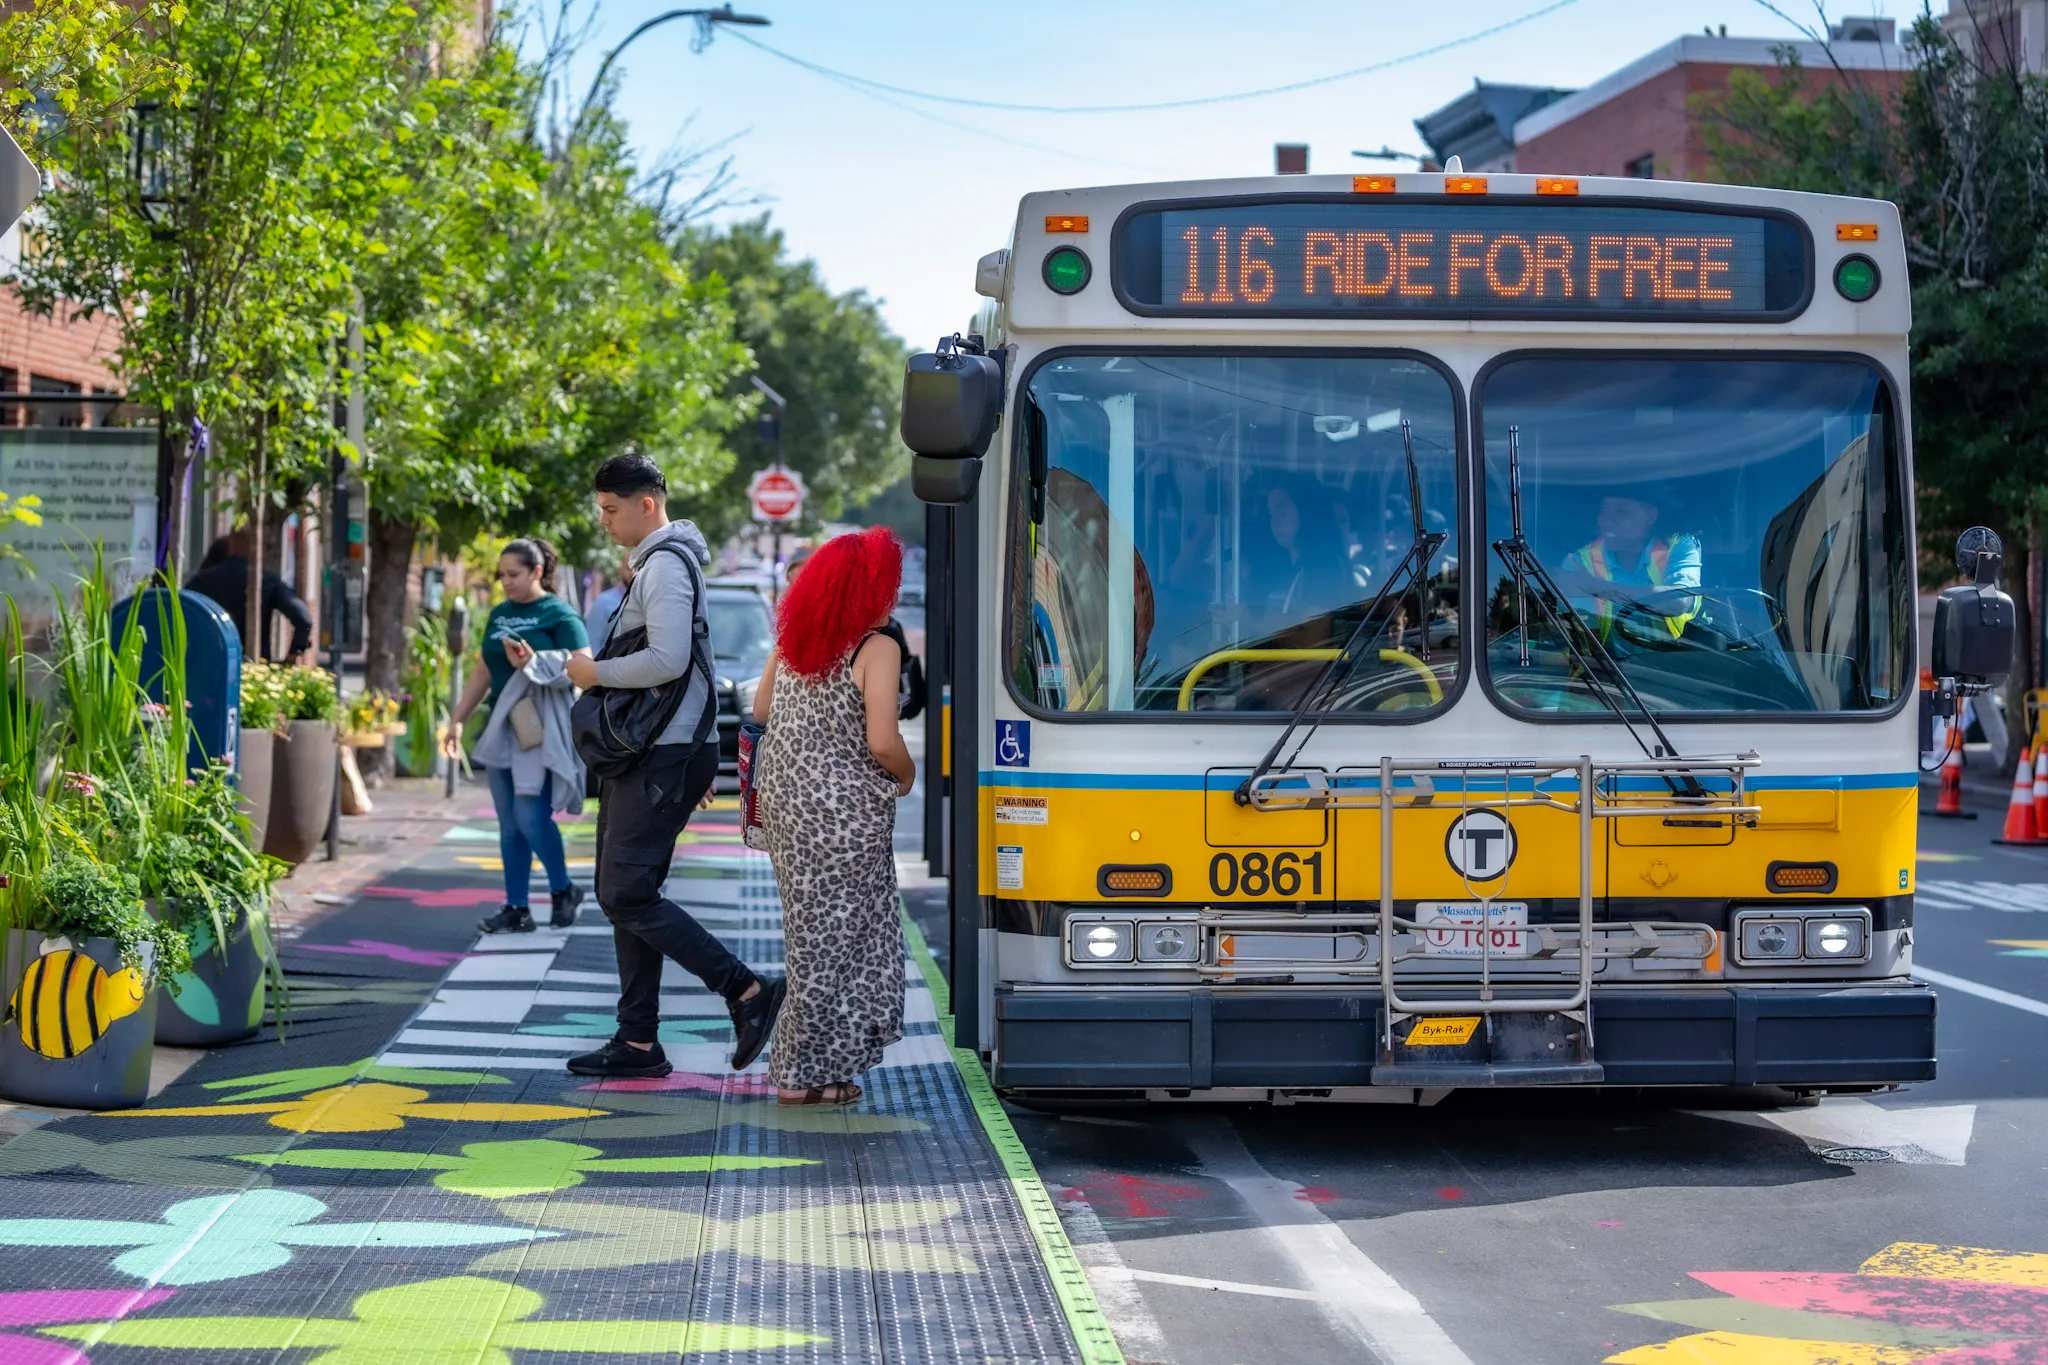
The Chelsea Flower Walk project is a partnership between the City of Chelsea, BostonBRT, AdHoc Industries, Studioful Design, La Colaborativa, and local artists, that was launched in August 2023. Its goal: improving the bus transit experience, beginning with the very place riders wait by combining engaging graphic design, immersive art, plants and trees with a Zicla level-boarding bus platform to enhance accessibility.
The Research
As a key partner in the project, the HAPI team conducted studies of the before and after-art installations at the stop using biometric software from iMotions.com. Over the course of four weeks, fifty-nine participants took part in this 4-minute online study where they looked at paired images on their laptops (or desktops) with computer webcams tracking both their eye movements and facial expressions.
Key Findings – Eye Tracking
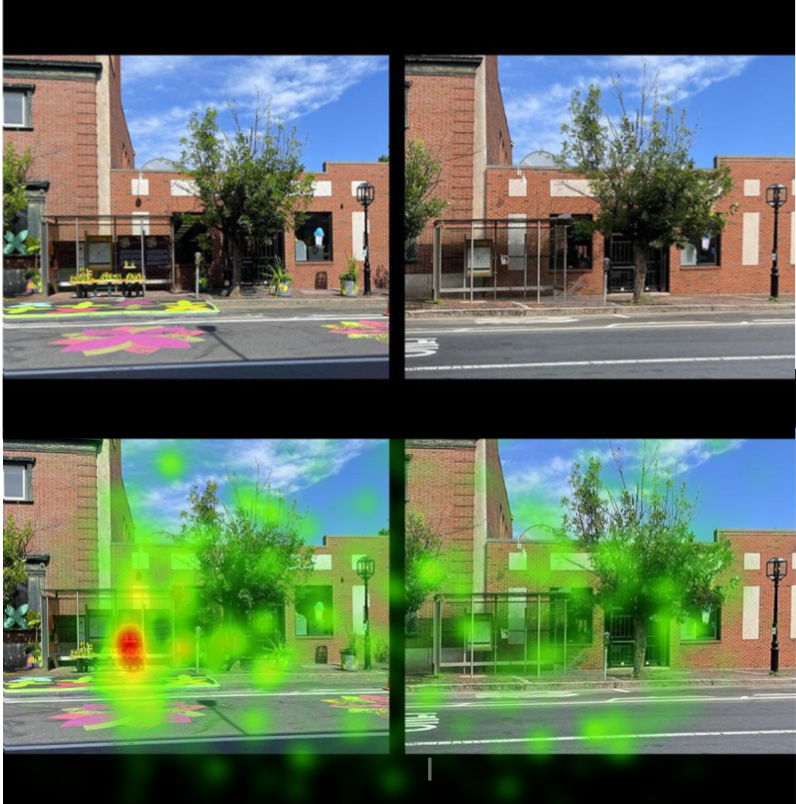
Biometric tools, including eye tracking, are widely used in the advertising, automotive, and business world today to better understand the client experience. Eye tracking records both conscious and nonconscious eye movements revealing how we take in the world around us as the primates we are – often without conscious awareness or control. Figure 1, above, for example, shows the results of eye tracking images of the original bus stop paired with its redesign.
Eye tracking generates heatmaps that aggregate viewing results, glowing reddest where participants looked most, then fading to yellow, then green, as attention decreases, and finally, displaying no overlay color at all on areas ignored. Note how the heatmap, above, in Figure 1, glows reddest on and around the bench and then fades to yellow and green around the colorful flower patterns at its base; note also how there is no comparable focal point on the original bus stop – no red or yellow appear anywhere.
These results suggest how the original bus stop is unlikely to draw the attention of passersby. Eye-tracking studies of the built environment frequently reveal similar results; humans are hardwired to seek out organized complexity and shun blankness, no matter where we are or what we look at.
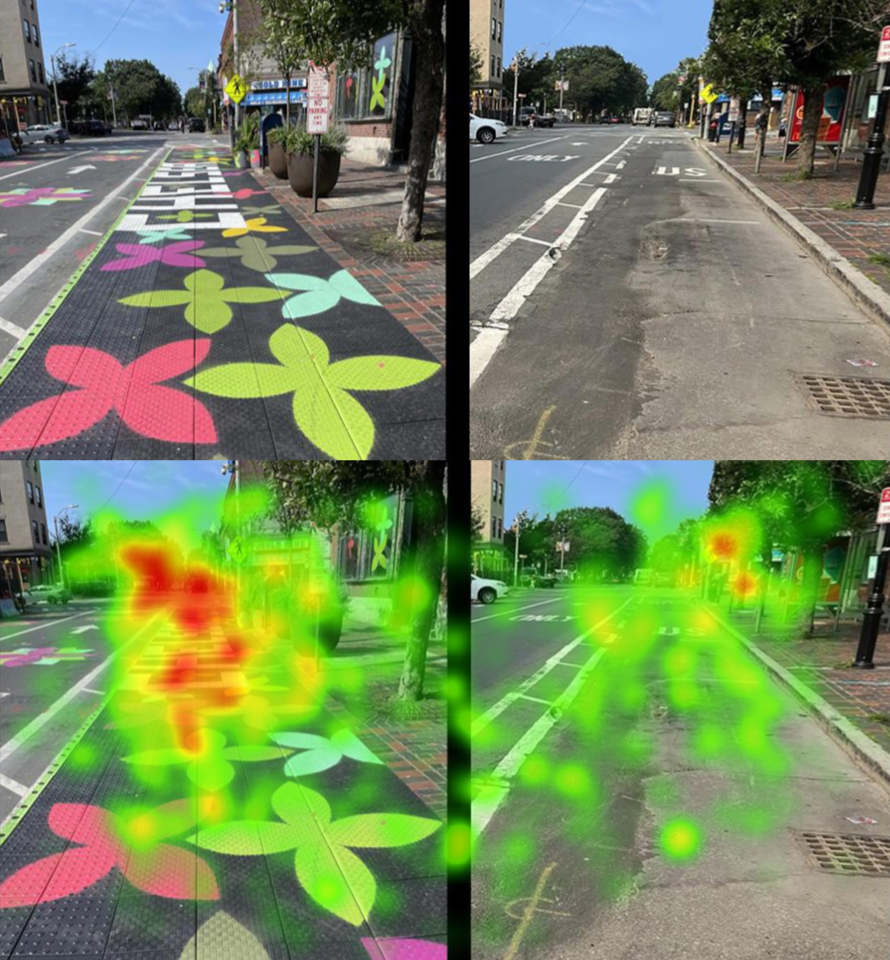
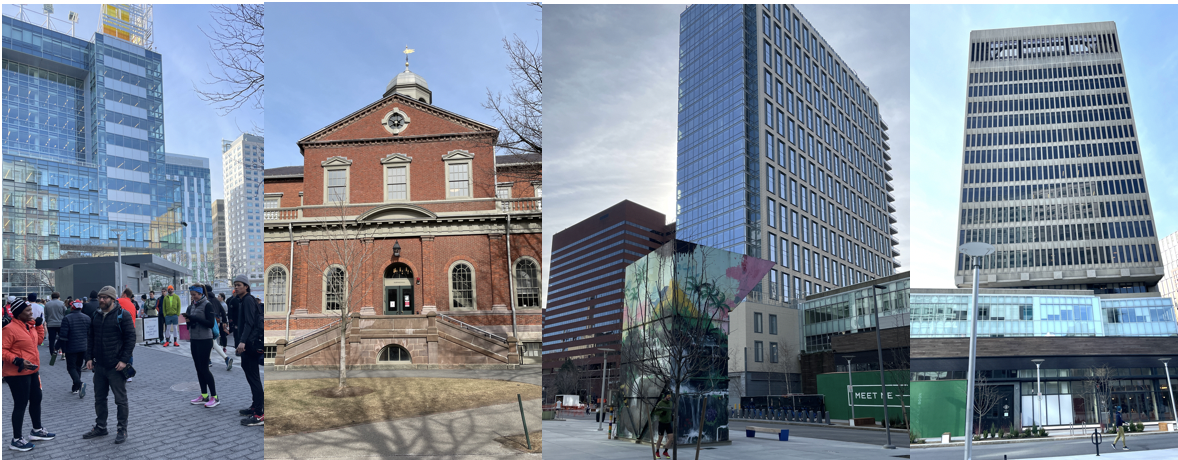
Figure 2, above, shows the power of the colorful flower patterns around the redesigned bus stop to capture attention. Here an image of the original blank asphalt road by the bus stop was paired with the newly designed Zicla bus platform. The heatmaps show how the new platform instantly drew viewers in, while the blank roadway could not, barely rendering a single bright red dot. The results also indicate the brain’s propensity to seek out edge conditions and areas of contrast; note heatmaps focused on distant trees and areas of color contrast; (this makes sense when you think about it, our perceptual systems evolved for survival.)
Key Findings – Emotional Experience
But how did the redesigned bus stop make people feel? Eye tracking records where people look, not how they feel, or emotional valence, which may range from positive to negative, to neutral. To capture how people felt about bus stops, the study included a preference questionnaire (see Figure 3) and used software that analyzes emotional expression bundled in with the eye-tracking software (from iMotions).
Figure 3 shows how the preference question appeared in the study. At the study’s conclusion, we learned that 49 of the 59 participants (or 83%) preferred the new design, 4 participants (7%) preferred the original, and 6 (10%) indicated no preference at all.
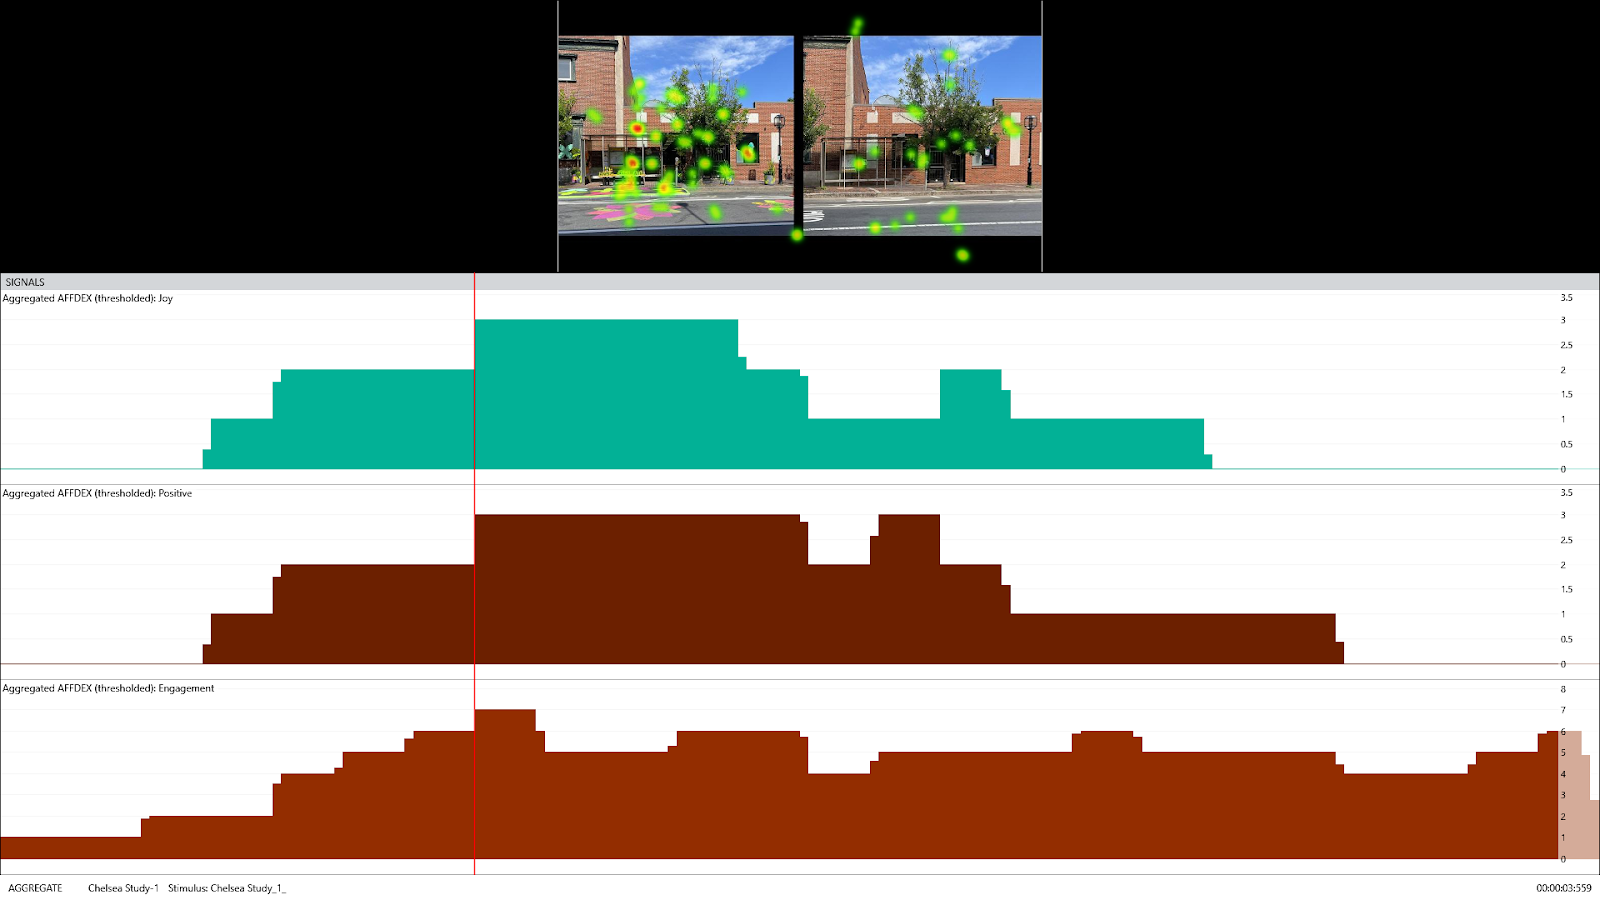
Emotional experience may be further measured with emotional expression software (Affectiva), which tracks facial muscle movements and how these change depending on stimuli. While still photographs generally do not elicit a great deal of emotional expression, (videos generally yield stronger results) we found the facial data collected nevertheless correlated with the preference study. For instance, Figure 4 shows participants experiencing joy as they took in the redesigned bus stop. The red vertical line, below the heatmap, indicates where participants looked as they experienced positive engagement, showing views falling mostly around the redesigned stop.
Similarly, Figure 5 shows the new flower walk generating joy; note the heatmaps, falling on the painted walkway as positive engagement spikes.
Emotional heatmaps, in Figure 6 and Figure 7, below, provide yet another new metric for viewing emotional experience, presenting results at a glance.These use color washes over a study image to indicate which emotions are experienced where. Figure 6 shows joy and positive feelings surrounding the new bus stop, and Figure 7 shows positive feelings predominantly around the new flowery walkway (images presented in black and white so that the color wash can be readily seen).
The results here indicate how the 21st-century is a remarkable time giving us access to powerful tools, such as eye tracking and facial expression analysis, that can be used to reveal how the human experience of place happens. In the Chelsea study, we saw how people’s feelings and behavior change when blank surfaces around a bus stop are redesigned with colorful patterns, plants and flower art.
This pilot study demonstrates how nonconscious behaviors direct the human experience in urban environments much more than most realize and current transit planning practices acknowledge. It also suggests the potential to design happier urban spaces by acknowledging and respecting our innate biological biases. This study specifically revealed:
How the original bus stop did not attract attention and will likely be ignored by passersby;
How adding color, nature and art to the roadway around the bus stop can change human perception and produce measurably positive experiences, including joy;
How quickly the engagement with a transit stop does – or does not – happen;
How surrounding advertisements, street lights, and signage, tend to draw attention away from the bus stop rather than at it.
The study also suggests a path forward for future research, looking not only at transit stop design but also at roadway design and wayfinding, one that heeds human perceptual biology and biases. Given that humans tend to walk with their head looking down, (at an angle of about 10°-15°) how much does patterning on roads and sidewalks matter? Should we measure human unconscious experience in our transit plans? Should sidewalk and roadway design begin with it?
Today’s biometric tools place us at an inflection point; we now have a remarkable opportunity to understand humans better than ever before. The question becomes, of course, – will we use these technologies to build better places for people – or not. And if not – why?
“The broader one’s understanding of the human experience, the better design we will have,” Steve Jobs once famously said. That kind of thinking is at the root of Apple’s stratospheric success; imagine applying it to create our public spaces!
Many thanks to City of Chelsea and creative partners on this project, including ITDP, Adhoc Industries, Studioful Design, Civic Space Collaborative, who made it possible; many thanks to iMotions team for their guidance and software + to the HAPI Team researchers Hernan Rosas and Alexandros Lavdas for their expertise.
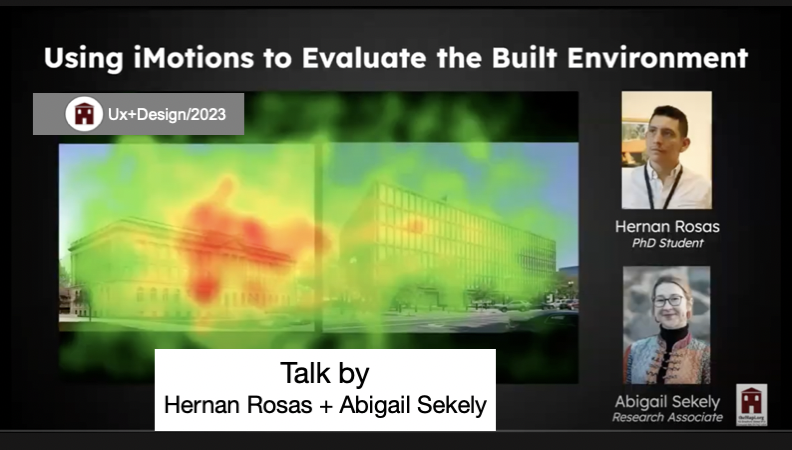
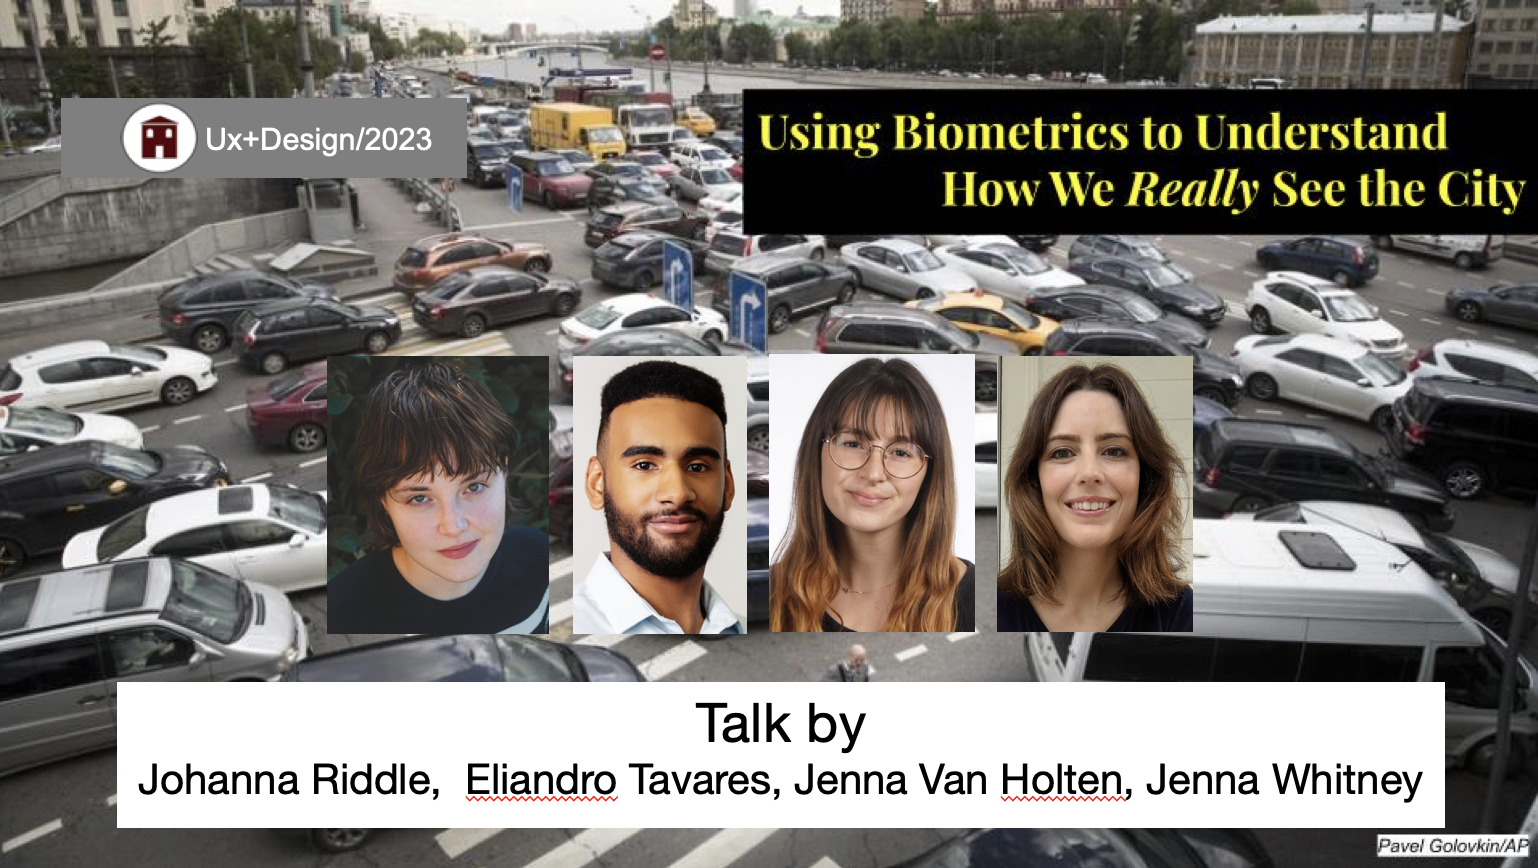
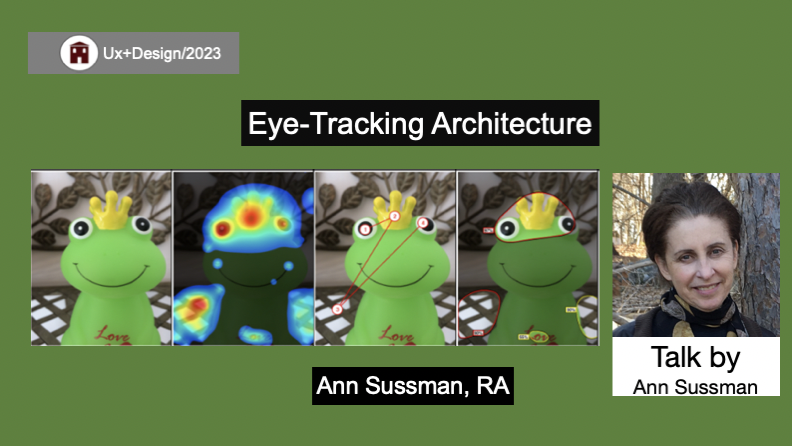
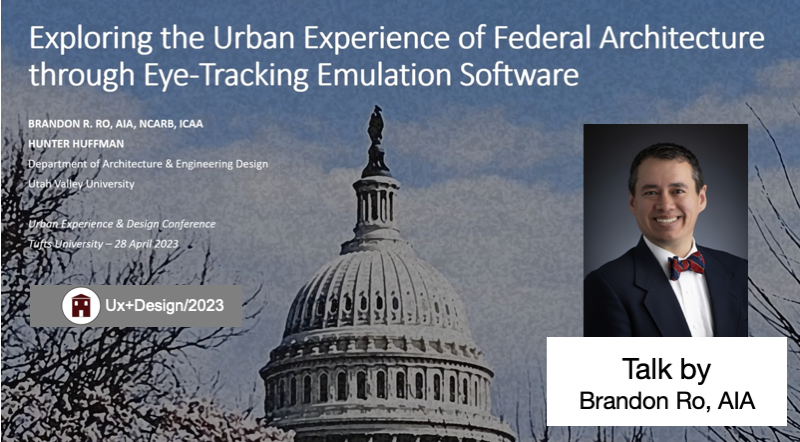
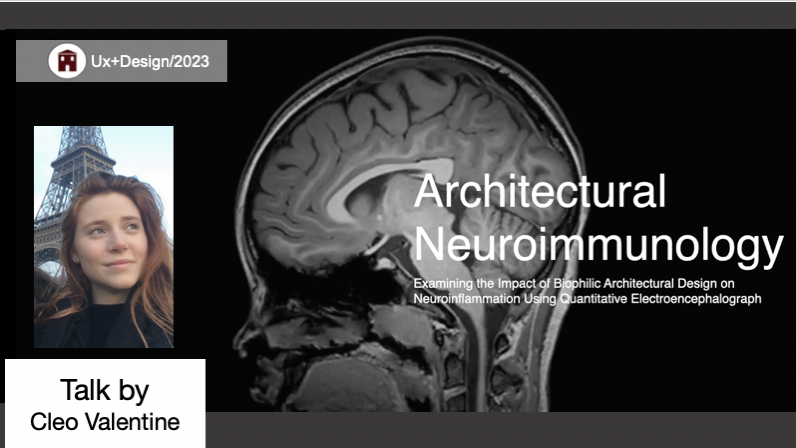
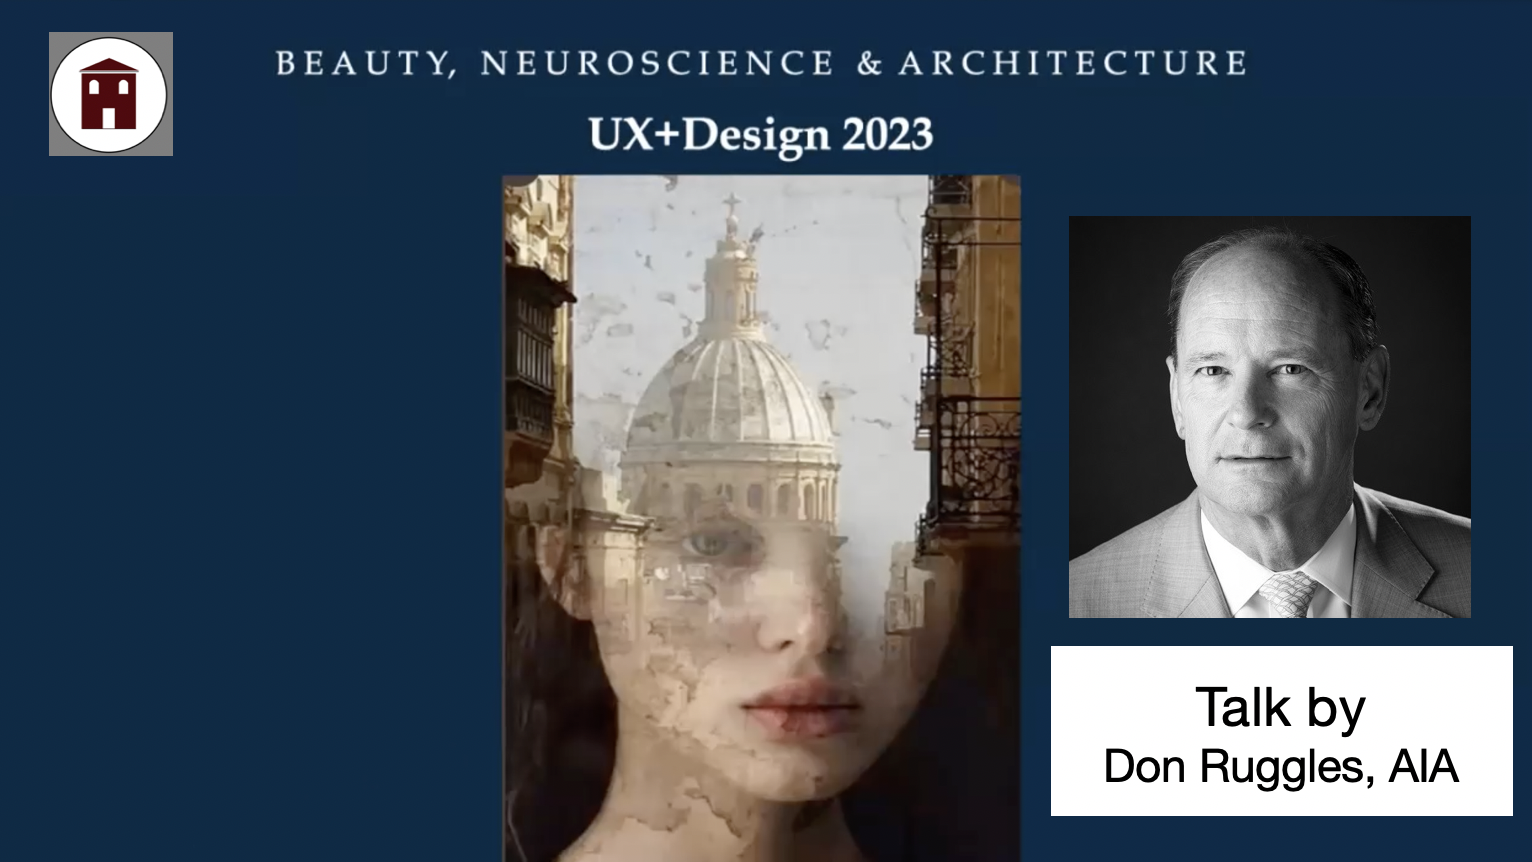
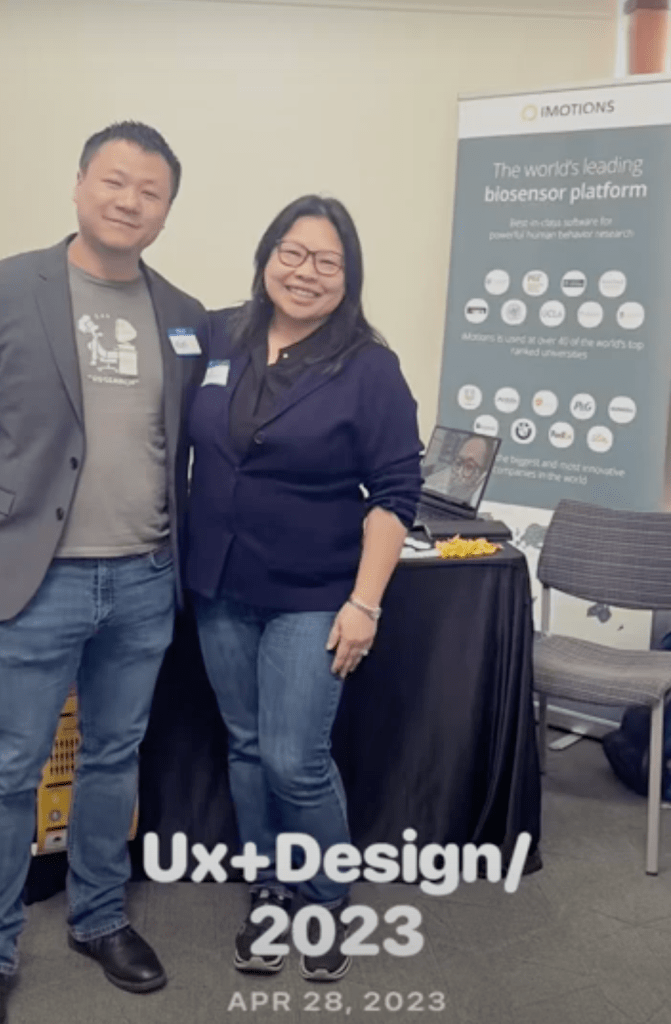
How do we look at buildings? Eye-tracking is one of the tools we can use to understand how our brain directs our behavior in the built environment, without our awareness, more than most realize. Check out these talks, presented at Ux+Design/2023 conference at Tufts, in April, now on TheHapi.org’s Youtube channel:
These studies use state-of-the-art software from iMotions.com, a global purveyor of biometric tools for human behavioral research. They are co-sponsored by theHapi.org (the Human Architecture + Planning Institute) a nonprofit dedicated to understanding the human experience of the built environment and improving its design through education and research.
And, thank you to all participants for taking part this month; we look forward to having results out very soon, and sharing them widely!
For more info on this project and its ITDP, Adhoc Industries, and other sponsors, check out:
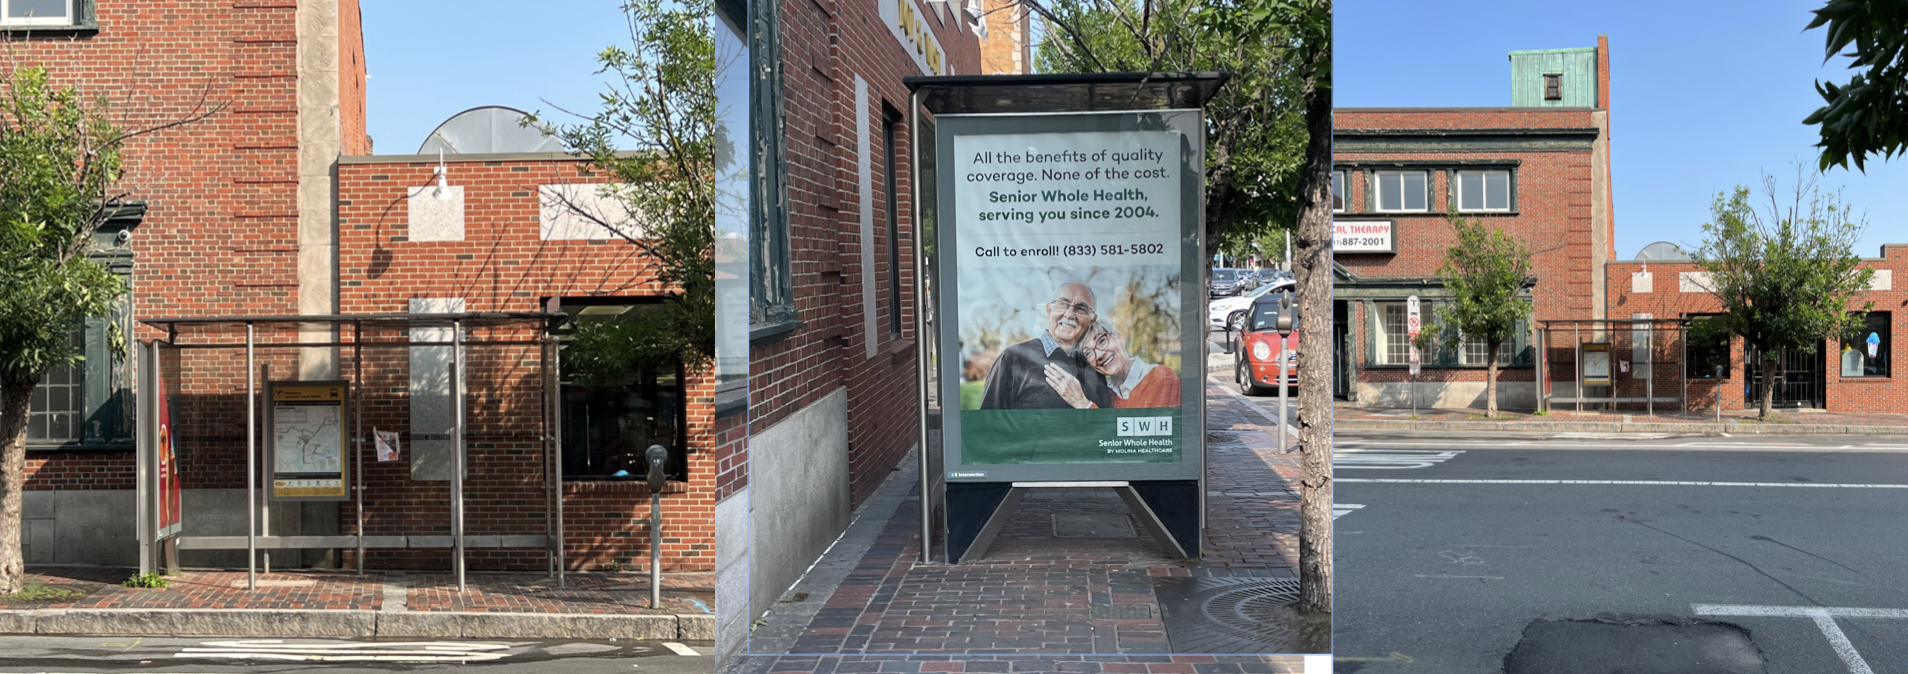
Aiming to increase ridership and improve the transit experience, the City of Chelsea, MA, engaged local artists and designers to add flowers and a new patterned walkway to a central MBTA bus stop.
“It’s not just about the functionality, but it’s also about creating an experience that’s joyful,” said Adrian Gill of Ad Hoc Industries, one of the leaders of the initiative, in The Boston Globe. “It is a fully immersive concept that we’ve created. It’s a very interactive environment.”
“It’s really kind of creating a bit of a destination spot at the bus shelter,” added project artist, Claudia Paraschiv, of Studioful Design.
The Human Architecture and Planning Institute, theHapi.org, contributed to the effort, using biometric tools to reveal the mechanisms behind why the artful interventions work.
A study with 3M’s Visual Attention Software, (VAS) which predicts where people look at-first-glance, shows how the bus stop before the intervention was likely ignored and how readily it comes into view with the added art and flower patterns. VAS displays results with four types of images, as shown below:
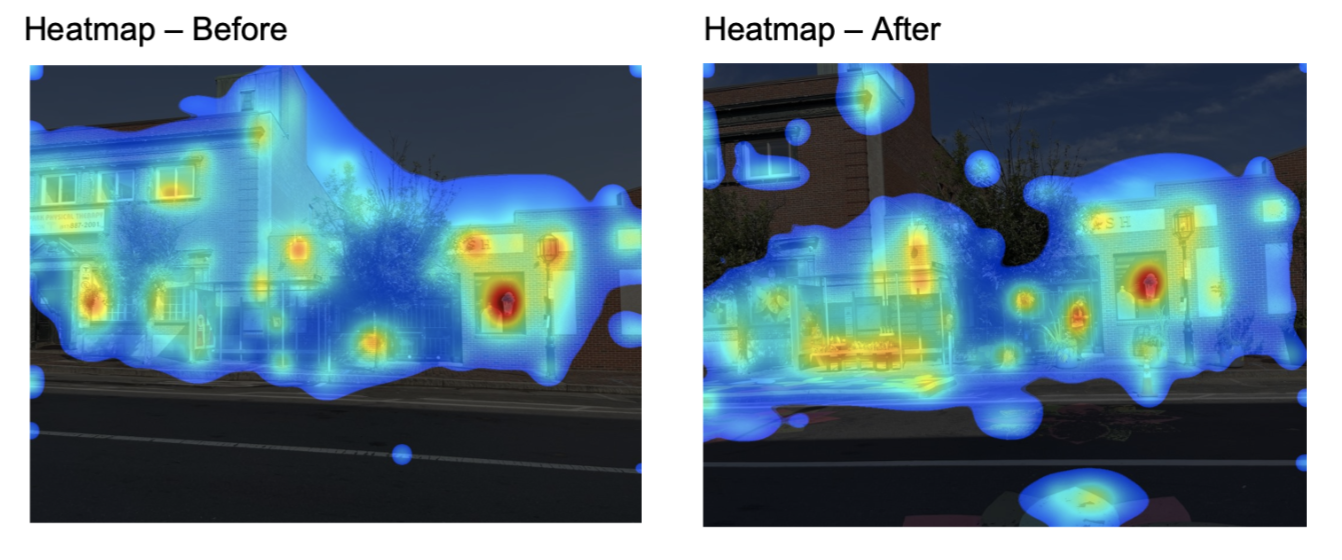
VAS-#1 Heatmap
Heatmaps glow brightest in areas that get the most attention, fading to blue in areas receiving less and then black in areas getting none. Note how sidewalk and roadway, at left, near the bus stop are almost all black, before intervention, and are less so, at right, after.
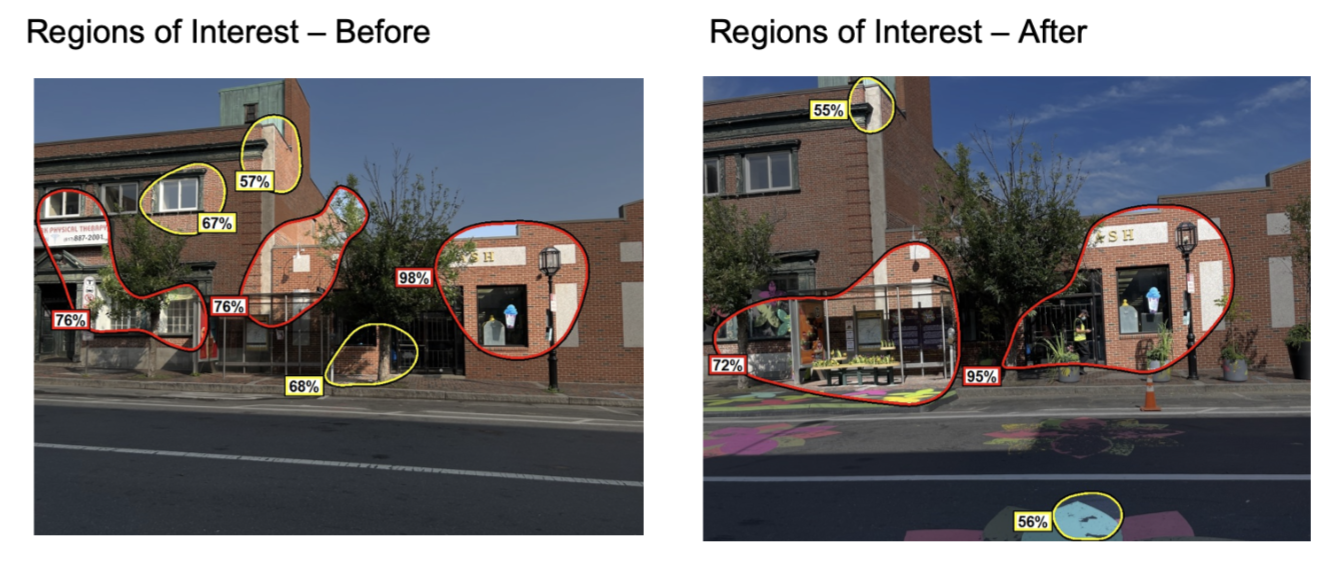
VAS-#2 Regions of Interest
The Regions of Interest (ROIs) diagrams, outlining in red where highest percentage of views likely fall, show attention goes to areas around the bus stop, rather than on it, before theintervention – and how things really do shift afterwards, with 72% of views falling directly on the bus stop with its added flower art.
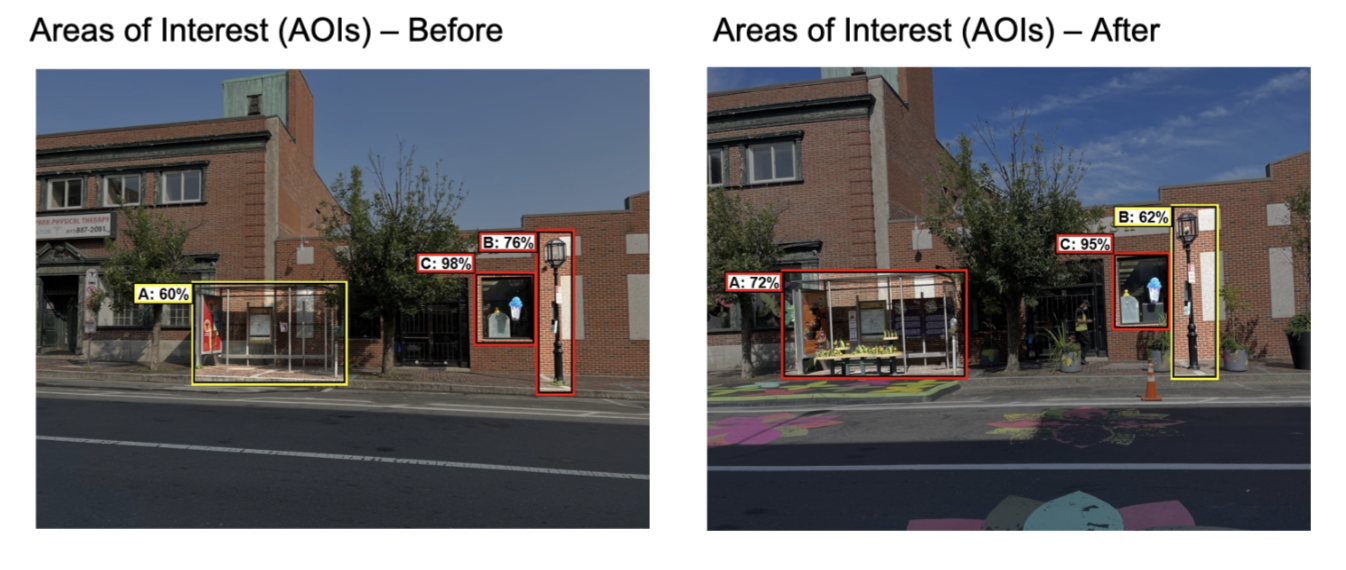
VAS-#3 Areas of Interest
Area of Interest diagrams (AOIs), as shown below, drawn around specific areas to study, suggest how the artful bus stop draws attention away from the street light nearby. Before the intervention the street light attracted 76% of views and the bus stop only 60%; after the intervention, the bus stop gets 72% of views and street light views fall to 62%.
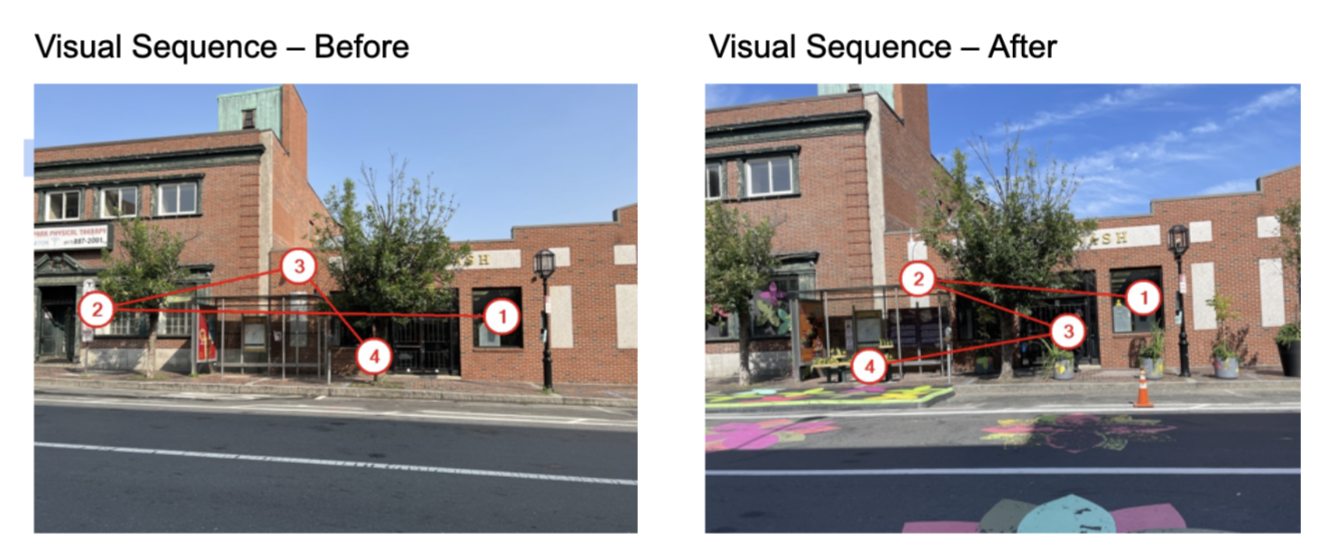
VAS-#4 Visual Sequence
Equally instructive, for understanding the project’s success, is checking out how the Visual Sequence diagram shifts before and after the installation.
Human visual perception happens in two phases; the first phase, during the first 3-to-5 seconds is driven by non-conscious visual processing triggered less than a second after we look at any ‘scene.’ VAS predicts how the brain has us take-in our surroundings in this first phase. Note, here, how the eyes focus around the bus stop rather than on it before the intervention, and directly on the bus stop after, with sequence 2 and 4 falling on the bus stop’s roof and bench.
It all goes to show how relevant it is to combine the arts and sciences. Good design acknowledges how humans work, and in our time, with access to remarkable tech, like 3M VAS, we now have the tools to help us do so, creating a happier, healthier pubic realm.
Thanks to the creative leadership team on this project including Boston Bus Rapid Transit initiative, ITDP,la Colaborativa, and City of Chelsea’s Public Works, for making the project happen and showing its possibilities.
Join us for an architectural PechaKucha event that explores the relationship between design and freedom. The event, over Zoom, was sponsored by improvscience.org, and part of a Freedom Festival, in honor of Juneteenth, that ran through July 4, 2023.
The 2nd International Urban Experience + Design Conference took place at Tufts on Friday, April 28th – a day-long event, open to all. Here’s the conference flyer, featuring a heat map that glows brightest where eyes rest most taking in the scene;
The conference was co-sponsored by theHapi.org, (the Human Architecture + Planning Institute), a nonprofit dedicated to understanding the human experience of the built environment and improving its design through education and research.
Full of energy and great ideas, the video here captures some of the energy in the room: https://youtu.be/gUsbkMwiJuE
These studies are sponsored by theHapi.org (the Human Architecture + Planning Institute) a nonprofit dedicated to understanding the human experience of the built environment and improving its design through education and research.
Anyone with a laptop or PC with webcam can take part; on a Mac, link to it from Google Chrome or Firefox (and it’s best to do so in a quiet space with minimal distraction.)
Once on site, the link directs you to eye-tracking calibration slides – where you simply focus on a shape as it moves across the screen – before image viewing begins. Each study concludes with a brief series of calibration slides, and takes a minute-or-two to upload your data.
And thank you for your participation; with your help we hope to improve understanding of how people experience the public realm!
These studies are sponsored by theHapi.org (the Human Architecture + Planning Institute) a nonprofit dedicated to understanding the human experience of the built environment and improving its design through education and research.
Your participation helps expand our understanding of how humans respond to the built environment and what we most need to see to be at our best.
Anyone with a laptop or PC with webcam can take part; on a Mac, link to it from Google Chrome or Firefox (and it’s best to do so in a quiet space with minimal distraction.)
Once on site, the link directs you to eye-tracking calibration slides – where you simply focus on a shape as it moves across the screen – before image viewing begins. Each study concludes with a brief series of calibration slides, and takes a minute-or-two to upload your data.
And thank you for your participation; with your help we hope to have results out next month!