Does your morning commute spark joy?
Probably not, particularly if you exit the subway and face a blank wall. Add some artwork to that facade, however, and your internal joy meter will likely jump!
Check out the existing conditions in Davis Square, Somerville MA.
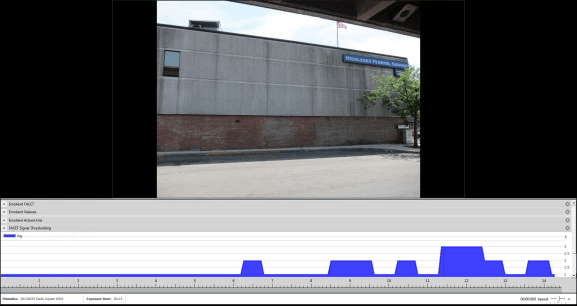
The picture is of the view people see when exiting the Somerville subway. The attached graph was generated by a biometric tool—facial expression analysis software—which instantly records how facial muscles move in a 14-second interval. The software produces real-time ‘joy graphs’ tracking the facial movements of people viewing the picture, specifically when people smile. In this case, the flat blue line in the graph suggests that at this stage of the commute, not that many people feel happy in Somerville.
Now check out what happens when we add a Matisse-like mural to the same facade.
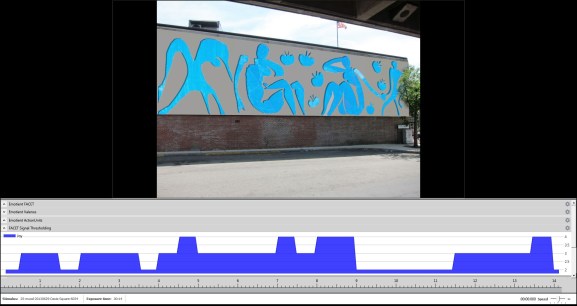
We get a lot more bounce in the ‘joy’ graph, it seems denser, telling us people smiled more and really do like it when Matisse greets them instead of blank concrete.
Welcome to the ‘Age of Biology,’ as the 21st Century is now labelled (by the OECD) We live in a remarkable time where biometric tools can reliably register our shifting emotional states and when the collection of real-time data on how architecture makes people feel and behave is feasible. Talk about a paradigm shift. In today’s world if you don’t talk about human emotions and behaviors engendered by design, you are passé. 20th Century. Old-fashioned! (Measuring human behavior is where it’s at now.)
These images come from our recent biometric pilot study where we asked 24 volunteers to view photos of Somerville, MA, to learn which cityscapes people liked most. We focused on ‘joy’ over other emotions including sadness, surprise, anger, fear, disgust, and contempt, hypothesizing that joy correlates best with what people would describe as a happy experience in the urban environment.
Below are other images from our pilot-study.
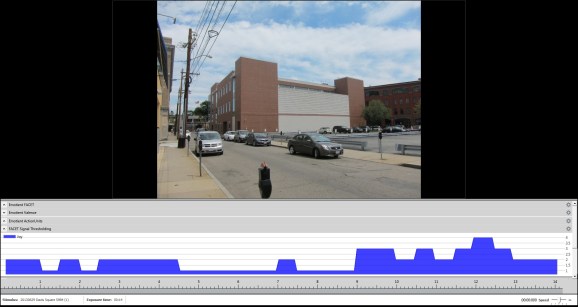
The photo above shows existing conditions in Somerville’s Davis Square which people didn’t seem happy about, judging from the relatively flat joy graph. The photo below includes a bouncier joy graph when we add more Matisse-like art to the mix.
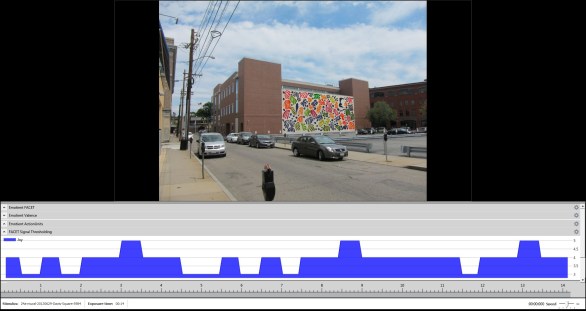
The larger blue areas on the ‘joy’ graph suggest that people felt more ‘joy’ taking in the colorful mural on the central building than with existing conditions, the blank gray wall.
Of course, to nail these findings we need to do further testing (with more volunteers and added biometric tools). Nevertheless, we think the trend is clear, and planners and architects, community leaders and developers should take note: people don’t like blank walls. They make folks unhappy. Design and rehabilitate accordingly.
And know that, with the arsenal of biometric tools expanding, we can now reliably figure out how to bring more ‘joy’ back to our cities—maybe even the morning commute.
________
Special thanks to Boston office of iMotions (imotions.com) for providing access to the state-of-the-art software and biometric study expertise.


I don’t think much sophisticated software is needed to conclude that ‘people don’t like blank walls.’
LikeLike